Welcome to the fourth quarter. A short three months from now the fiscal-year ends and your portfolio’s report card will be set in stone!
If you’ve been sitting on the sidelines for the past few months or you’re wondering which sectors will be able to give your portfolio a little year-end juice, now’s your chance to find out.
It all comes down to four mega-trend charts. Decipher the code on this quartet and profits will surely follow…
This year the markets have had a certain bit of predictability. Betting on the probability of a few continued trends could pay off handsomely, too.
Put the government shutdown distraction aside, toss out the debt ceiling fodder and the trends are clear. Today we’ll take a look at the most important four…
In case you missed it, the dollar has been dipping. Regardless of taper talk, the greenback is in broke back territory. That is, no one believes the myth of the taper – and the chart proves it!
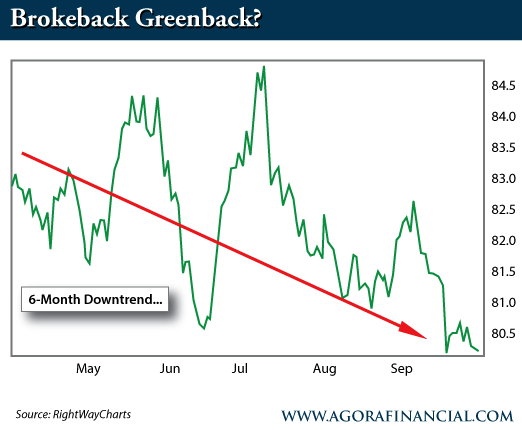
With the dollar we’ll want to keep an eye on the psychological 80-level, solid support for nearly 2 years could be about to break.
Remember, commodities like gold and oil are priced in U.S. dollars. A continued downtrend will support resource players and provide support for prices. And with support waning for the greenback, the fourth quarter could find a stiff wind to the back of commodities.
Crude has been stout this summer. With impending war in the Middle East and supply disruptions du jour, the price has found support above the $100-level.
However, we may be finally seeing some weakness in crude. After rallying throughout the summer on Middle East supply concerns the price has more recently pulled back, nearing the important triple-digit threshold.
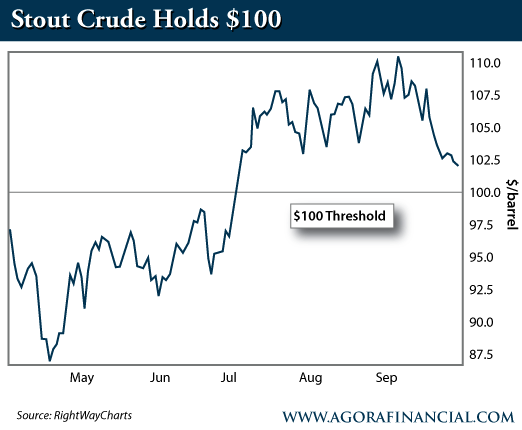
If you’ve been keeping track of our ongoing crude discussion you’ll know that, above $100, oil seems a little top-heavy.
That is, the U.S. shale boom is moving ahead at full steam – oil production is ramping up here in the States in big wasy. The same goes for the resurgence in Iraq’s oil industry. When you add those two factors together you’ll notice that, in the coming years, there’s about to be much more oil sloshing around the system.
Without a “fear premium” from possible supply disruptions in the Middle East (see: Libya, Egypt and Syria) we could see oil drop below the $100-mark. A more natural, supply/demand-driven price would be around the $85 mark. Of note, that’s still plenty high enough for U.S. shale producers to make a buck.
Time will tell where the price of oil goes, but again, without Middle East disturbance, look for prices to mellow out in the $85-95 range for the remainder of the year. Besides price action, U.S. shale producers (the efficient, well-run guys we’ve been talking about) will remain highly profitable – the sky is the limit for some of these “next Exxon” type players.
Year over year gold is down nearly $500 an ounce – a 27% pullback.
With gold – and all precious metals for that matter – we’re waiting for signs of life. Said another way, we’ll need to see more price support – a key factor for the market to head higher.
Over the past six months we’ve seen modest support build at the $1,300-level. In order to trust this underlying support we’ll need to see prices stay above the $1,300-threshold in the short-term. A little “sideways” trade here (where prices stay right around $1,300 for a while) will surely help.
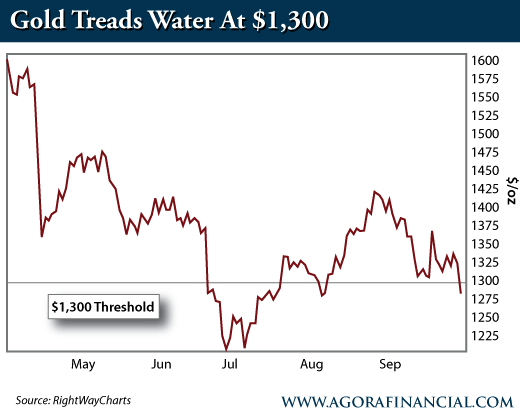
But, before you jump headfirst into gold’s next uptrend, let the price per ounce be your guide. If support fails at $1,300 we could see another 10% shaved off the price per ounce in quick order. But, If prices can hold that near-term $1,300 threshold, momentum will mount for the metal and mining shares – providing plenty of time to grab your favorite plays.
Rest assured that I’ll be waiting for gold’s defining moment. When it happens you’ll be the first to know.
While we keep a keen eye on commodities you won’t want to overlook an important market barometer, the S&P 500.
Fact is, this year if your portfolio is up more than the S&P you’re sitting pretty. The broad-based index is up nearly 19% on the year – quite a run-up, indeed!
Whether you rack this gain up to the Fed’s artificial filler, “QE Infinity” or to solid earnings from recovering companies, you CANNOT deny the fact that stocks have been on fire.
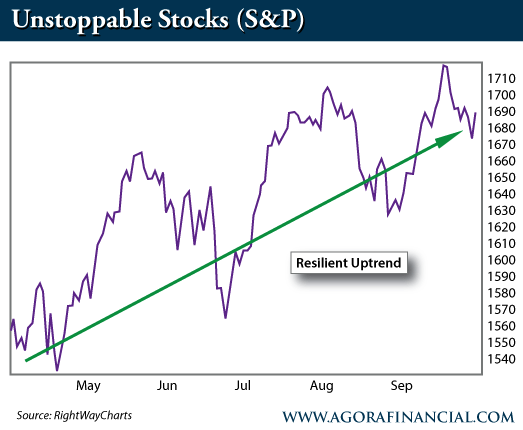
Each recent market pull-back for the S&P has been met with a greater gain. To be sure this chart alone shows that the overall market has been very resilient, even in the face of war in Syria, economic worries, government shutdowns and debt ceiling debates.
Are we back to the market’s good old days? Only time will tell. But rest assured that as long as the Fed continues to throw money on the pile (at a clip of $85B a month) this index will churn higher.
Remember, a surging market will get many wayside-sitters back into the game. Those folks that haven’t participated in latest run-up in stocks are soon to join in. In this sense a rising tide will lift all boats. And surely, as we’ve seen, some boats will be lifted higher than others. Like our friends the domestic oil producers!
So where are we heading in Q4?
The great part about looking at charts, like those above, is that they never lie. We don’t need to listen to White House rhetoric or Fed statement BS. Instead we can filter out the day to day noise and put profit probability on our side!
That said, the dollar is due for a stint below 80 – which means good price support for our favorite commodities. Likewise with more QE coming our way the S&P should continue to burn higher.
Add it all up, you and I would be amiss to neglect U.S. energy stocks. Underlying price support for energy, along with an uptrending stock market could lead to a nice double digit gain in three short months.

Leave a Reply