I just got my hands on the latest import statistics out of China and there could be an odd takeaway hidden in the data, albeit a contrarian one.
As you may have heard, China’s gold purchases for 2013 got off to a slow start. After hitting a record high of 114 metric tons in December of 2012, gold imports dropped to 51 tons in January of this year.
In February imports shot higher to 97 tons. That’s well above 2012’s average monthly import numbers. Clearly demand was starting to perk higher.
This week the numbers for March hit the airwaves…like a sonic boom…
Here’s a longer look at China’s import data:
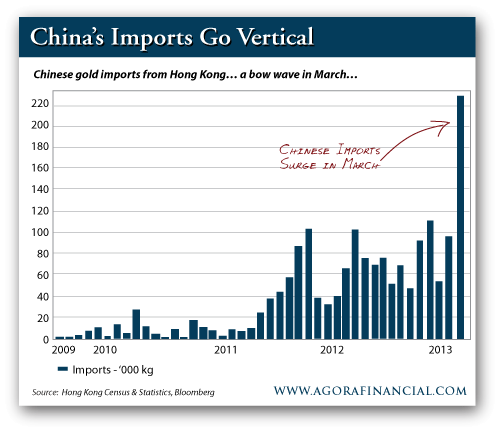
The recent swell in gold imports to mainland China can’t be ignored. Indeed, China’s gold tally is getting higher by the month and could be well over 7,000 metric tons. That would place China as the 2nd largest gold holding country – and not far behind the U.S.
Although in March, the general swell in imports turned into a BOW WAVE. Gold imports to mainland China reached an all-time high of 223 metric tons.
That’s 223 tons in just one month! In comparison to last year’s data, this one month is more than the first three months of 2012 combined. On a broader scale, that’s nearly half the gold held by the European Central Bank. And it’s more gold than the total holdings of many central banks – including Thailand, South Africa, Mexico, Singapore, Greece and plenty others.
223 metric tons is a huge, chart-busting, boat-rocking number.
But here’s the real head scratcher…
Could This Huge Import Number Be Related To Gold’s Pullback?
Here we are about a month from gold’s recent fallout and there haven’t been any finite fundamental reasons for the drop. As you’ll recall, gold prices fell off a cliff in mid-April – over a three day period, prices dropped more than $200 per ounce.
Some folks racked it up to the “end of the golden bull”, others simply figured it was due to a negative Goldman Sachs (GS) report or a technical chart pattern. Or maybe the price was maliciously manipulated by central banks?
Indeed, usually by this point in a commodity’s pullback we’d have a full explanation for the pullback. But instead all we have are a few puzzle pieces.
From the pieces, a new explanation for gold’s recent pullback is emerging…
The March import data out of China, to me, is a hint that something’s fishy with this market. Indeed, I’m not sold on the idea that China’s massive gold buy isn’t in some way connected to gold’s quick, April selloff.
Sure, at the onset, a high import number for China is bullish. Naturally, if China is hoarding gold at a quicker clip than ever(!) markets should reacted bullishly to this data. Following the same line of thinking, this bow wave of physical gold demand should have kept prices well-bouyed in March.
But in pure speculation, say this huge influx of purchases, much like a big kahuna wave in the ocean, created a small trough behind it – an “ebb” of Chinese gold purchases, if you will.
Or even further down the conspiracy hole, what if this huge purchase was forecasted… and that the impending ebb was one the way? That is, say this massive (government?) gold buy was pulled forward for some reason and a pullback was all but certain in its aftermath?
It’s all speculation at this point. But, if it was clear to a handful of short-term traders – you know, those guys in the “good old boys” club that get the insider information — there could have been a way to play the downside.
Now don’t get me wrong, I’m not saying this monthly data out of China caused gold to drop $200 over a 3-day span in April. I don’t believe a short-term lack of China buying could have that kind of downward pressure. But, there’s good reason to believe that the selloff could have started on the back of the massive wave of Chinese imports.
Then once the selloff began, other market forces — standing sell orders, momentum traders, etc – kicked in and took gold on a swan dive lower.
I had a quick chat with one of my colleagues and we’re both on the same page that today’s gold market isn’t the same as it was back when gold’s bull market began. Since then we’ve seen an influx of new, weak-hand gold buyers along with a bevy of gold-backed electronically traded funds (ETFs.)
So while a burp from China’s imports could have been the first domino to fall, there’s likely a lot more reason for prices to head lower, faster then there was in the beginning of gold’s decade-long rally.
A Quick Boomerang Back?
Fast forward to today and since gold’s pullback we’ve seen a v-shaped recovery to $1,450. That partial recovery comes on the back of worldwide physical buying that occurred since gold’s drop.
Following through with our logic above: China makes a huge gold buy…. Then, buying slows enough to spur a sharp downtrend in prices…. Next, prices drop so low that physical demand starts back up on bargain hunting.
Again, I think there’s something fishy going on in this market and ticker tape from March/April is still unraveling.
That’s all I’ve got for today, but rest assure I’m keeping an eye on this situation. The fundamental reason for gold’s pullback is an important feather for our cap. That said, it’ll be interesting to see what China’s import data looks like for April and where gold prices head from $1,450. Stay tuned.

Leave a Reply