Broad market indicators like the S&P500 have been making all-time nominal highs. What’s the significance of that for investors and the economy?
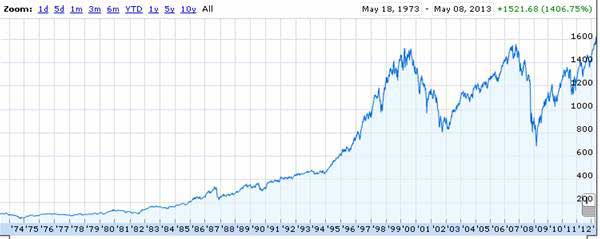
S&P500. Source: Google Finance.
Rather than just look at nominal stock prices, it makes more sense to compare the price relative to earnings. Yale Professor Robert Shiller has suggested relating the current inflation-adjusted S&P500 to the previous ten-year-average of inflation-adjusted earnings. While one could reasonably argue that what happens over the next ten years is more relevant than what happened over the last, an advantage of Shiller’s approach is that it is perfectly objective and one can see what kinds of values have been typical going all the way back to 1880. By Shiller’s measure, the current backward-looking real P/E is up to 23.4, well above its historical average value of 16.5.
Green line: Ratio of real value of S&P composite index to the arithmetic average value of real earnings over the previous decade, January 1880 to May 2013. Red line: historical average (16.5). Data source: Robert Shiller.
If the ratio of price to historical earnings is unusually high right now, and if you expect the ratio to revert to more typical values, it suggests that you should expect a lower capital gain on stocks you buy today compared to what you would have earned if you bought at a time when the P/E was at or below its historical average. The blue line in the graph below shows the annual rate of return you would have earned by buying stocks at any indicated date and holding on to them for the next decade. That line stops in May 2003, because we don’t yet know what the 10-year return of a stock purchased in June 2003 will turn out to be, and we certainly don’t know what the 10-year return on a stock purchased in May 2013 is going to be. But what we do know is that in the historical record, you did indeed tend to earn a lower return on stocks if you bought them at a time like today when the P/E is relatively high.
Green line: Ratio of real value of S&P composite index to the arithmetic average value of real earnings over the previous decade, January 1880 to May 2013. Red line: historical average (16.5). Blue line: average compounded nominal rate of return on stocks purchased at the indicated date and held for ten years from that date. Data source: Robert Shiller.
So how will you do if you buy stocks today at these historically high valuations? Fernando Duarte and Carlo Rosa of the Federal Reserve Bank of New York surveyed 29 different forecasters and models for their calculation of the expected return on stocks relative to that on bonds. Obviously you want to take anybody’s claim that they know where the stock market is headed with a rather large grain of salt. But it’s interesting that the consensus assessment of this group is that stocks will outperform bonds by as high or higher margin as ever would have been expected over the last half century.
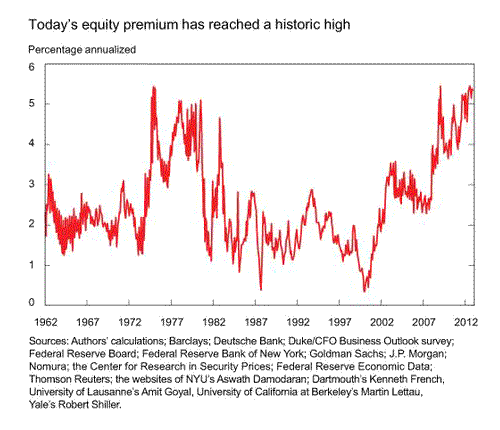
Expected return on stocks minus expected return on bonds from 29 different models. Source: Liberty Street Economics.
Actually there’s not a contradiction between saying that stocks will do worse than average over the next decade but better than bonds, provided that bonds are going to do much worse than average over the next decade. Duarte and Rosa conclude that this is indeed the primary explanation for why the current excess return on stocks is calculated to be so high. For example, the current yield on a 10-year Treasury Inflation Protected Security is -0.62% annually. So it’s not making too bold a claim that you can find something better than a guaranteed loss (in real terms) each year over the next decade.
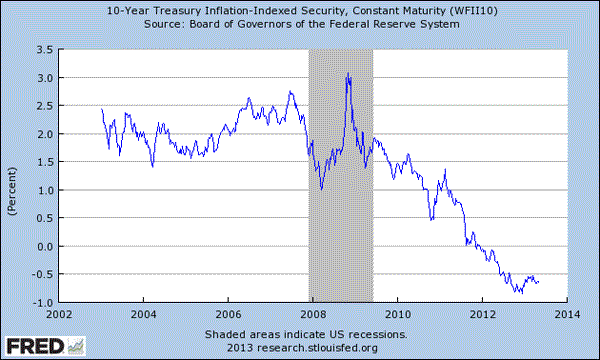
Source: FRED.
In part the strong stock market may be signaling optimism about the real economy. But another very important factor is that stocks look good primarily in comparison to the dismal return you can expect from bonds.
Disclaimer: This page contains affiliate links. If you choose to make a purchase after clicking a link, we may receive a commission at no additional cost to you. Thank you for your support!


Leave a Reply