The methods and conclusions of an influential paper by Carmen Reinhart and Kenneth Rogoff published in 2010 have recently been challenged by Thomas Herndon, Michael Ash, and Robert Pollin. Here I comment on both the details and broader significance of the dispute.
Let me begin by stating what I perceive to be the core policy question: are high sovereign debt loads something we should worry about, and if so, why?
The main reason that I personally am concerned arises from the fact that, for any level of the interest rate, a higher debt load means that the government will permanently need to spend more money just to pay the interest on the debt. This is not a matter for arcane debate, but rather is a consequence of the most basic arithmetic. At the moment, the interest rate on U.S. government debt is extremely low, so that despite our high debt load, the government’s net interest cost is currently quite reasonable. However, most projections call for interest rates to rise over the next few years, and the most recent assessment by the CBO notes that consensus interest-rate forecasts and existing fiscal legislation imply that within a few years, the U.S. interest cost will be bigger than the entire defense budget, and bigger than all of non-defense discretionary spending.

(click to enlarge)
Source: Elmendorf (2013).
Higher taxes will be needed to make those higher interest payments, and the adverse economic consequences associated with distortionary taxes are well understood. Moreover, as the debt load gets larger, the government’s creditors usually start to require a higher interest rate, which makes the interest burden of the debt even bigger. This creates a potential adverse feedback loop that can lead (and in many unfortunate historical cases, has led) to a major funding crisis. That higher debt loads are associated with higher interest rates has been found by many different researchers using many different data sets and methodologies. For example, Hibiki Ichiue and Yuhei Shimizu (2013) found these effects in a panel of 10 advanced economies over 1990-2010, of which Germany is the only eurozone member. Vincent Reinhart and Brian Sack (2000) found them in the experience of the G7 before establishment of the euro (1981-2000). Thomas Laubach (2009) noted that higher CBO projections of 5-year-ahead debt levels for the U.S. are associated with higher 5-year-ahead forward rates over 1976-2006. And Greenlaw, Hamilton, Hooper and Mishkin (2013) found a relation between debt levels and borrowing costs in the last decade’s data from 20 advanced economies. There is also evidence of nonlinearity in this relation, with debt levels mattering more as they get bigger and as the country’s current-account deficit grows; see for example Ardagna (2004), Baldacci and Kumar (2010), and Greenlaw, Hamilton, Hooper and Mishkin (2013).
I mention all this to highlight that none of the above issues or evidence has anything at all to do with the data, questions, or conclusions in the paper by Reinhart and Rogoff (2010) that has recently come into some controversy. Instead, what Reinhart and Rogoff studied in their paper was whether higher debt loads are correlated with lower growth rates of real GDP.
The specific evidence reported in Reinhart-Rogoff (2010) came from three different data sets. First, they followed 20 individual countries for up to two centuries, calculating the average growth rate for that country in the years when debt levels exceeded 90% of GDP and average growth rates for years with other debt levels. They reported these separately for each individual country (see Table 1 of Reinhart and Rogoff (2010)), and found that growth rates were slower when debt levels were higher. Second, they combined data from a panel of 20 different emerging economies over 1970-2009 and found that growth rates were slower when debt levels were higher. The recent critique by Herndon, Ash, and Pollin (2013) did not discuss either of these first two claims. Instead, their critique concerns Reinhart and Rogoff’s analysis of a third data set, a panel of 20 advanced economies over the last half-century.
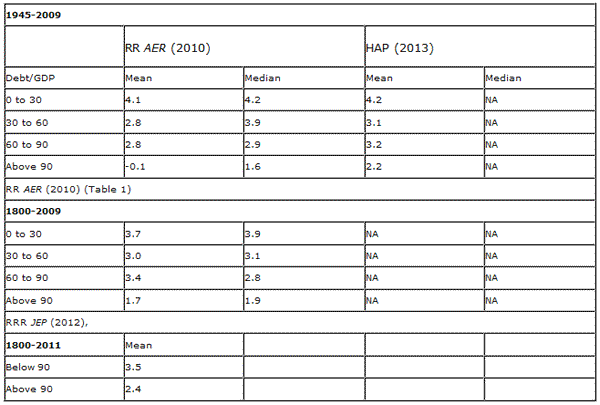
Let me first jump to the bottom line, and then review the details. Reinhart and Rogoff originally claimed that for this last of the three data sets, real growth rates were around 4% for low debt levels, 3% for moderate debt levels, and -0.1% or +1.6% for debt levels above 90%, with the latter difference depending on whether the aggregation was done using the mean or the median. Herndon, Ash, and Pollin claim that when the numbers are correctly tabulated, real growth rates are around 4% for low debt levels, 3% for moderate debt levels, and 2.2% for debt levels above 90%, with the latter inference based solely on the mean. The table below reproduces Reinhart and Rogoff’s summary of the differences in the bottom-line claims.
Now let’s take a look at the details by which Herndon, Ash, and Pollin come to their numbers. First, they found a dumb error in Reinhart and Rogoff’s spreadsheet– Reinhart and Rogoff left the first 5 countries in the alphabet (Australia, Austria, Belgium, Canada, and Denmark) out of the set of cells selected for averaging. This is a numbskull error, but it turns out it would only have changed the estimate they reported by a few tenths of a percent.
The major differences come from a difference of opinion about how one should summarize the mean for these data. For example, the U.S. spent 4 years in this sample with debt levels above 90% of GDP, while Greece spent 19 years. How should we combine these two sets of observations?
One view one could take is that the expected growth rate when a country has a high debt level is a single number across all countries, that is, you expect the real growth rate for Greece when its debt is 90% to be exactly the same number as the real growth rate expected for the U.S. when its debt is 90%. If you further believed that the variance of Greek growth around this mean is the same as the variance of U.S. growth around this mean, then the correct thing to do would be to act as if you have 19 observations on the number of interest from Greece and 4 observations from the U.S., and take a simple average of those 23 numbers. In other words, you should base most of your inference on the data from Greece, because that is where you have the most observations. This is the approach that Herndon, Ash, and Pollin insist is the correct one to use.
Another view you could take is that the expected growth rates for the U.S. and Greece would be different even if the two countries had the same debt levels. From that perspective, there is a different expected growth rate for each particular country when it gets to the 90% debt level, and our goal is to estimate what that number is for a typical country. That view seems to underlie the method chosen by Reinhart and Rogoff, which was to estimate an average growth rate when debt is greater than 90% for the U.S., a separate average growth rate when debt is greater than 90% for Greece, and then take the average of those averages across different countries.
One could go a step further and spell out a complete statistical model of the view just espoused, for which the optimal way of combining different observations would weight the Greek average more heavily than the U.S. average (because the Greek average is estimated with greater precision), but not 19/4 times as heavily as Herndon and coauthors want (because the Greek average is estimating something different from the U.S. average). The optimal statistical estimate from that perspective would be somewhere in between the Reinhart-Rogoff number and the Herndon-Ash-Pollin number.
In any case, as seen in the table above, whichever number you used, you would still conclude that higher debt loads are associated with slower growth in the postwar advanced economy data set, just as they were in the postwar emerging economy data set, just as they were in the centuries-long individual country data sets, and as also was found to be the case in separate analyses of yet other data sets by Cecchetti, Mohanty and Zampolli (2011), Checherita and Rother (2010), and the IMF (2012), among others.
A quite separate and in my mind much more legitimate question is whether this correlation can be given a causal interpretation– is it high debt levels that cause slower growth, or slow growth that causes debt to accumulate? One can (and should) be persuaded that the correlation is real, but still be in doubt as to what it signifies.
But none of these concerns change the basic reality that is summarized in the first graph above.
Disclaimer: This page contains affiliate links. If you choose to make a purchase after clicking a link, we may receive a commission at no additional cost to you. Thank you for your support!


Leave a Reply