In his March 24 Wall Street Journal piece on declining government payrolls, Sudeep Reddy offers up a key observation:
The cuts in the public-sector workforce—at the federal, state and local levels—marked the deepest retrenchment in government employment of civilians since just after World War II… down by about 740,000 jobs since the recession ended in June 2009. At the same time, the private sector has added more than 5.2 million jobs over the course of the recovery.
As the Journal article notes, the story of shrinking government employment combining with private-sector payroll expansion has been remarkably consistent for much of the recovery.
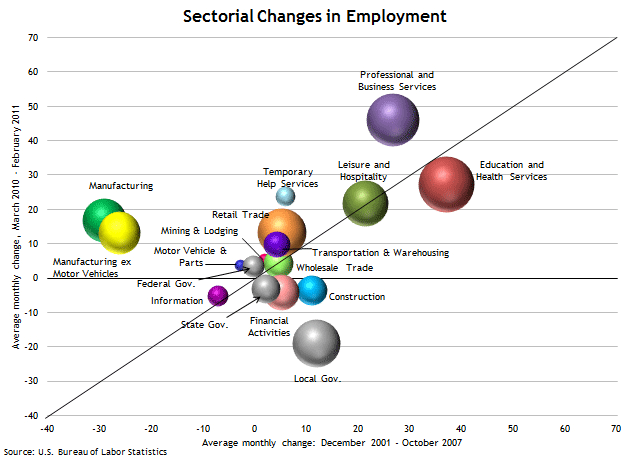
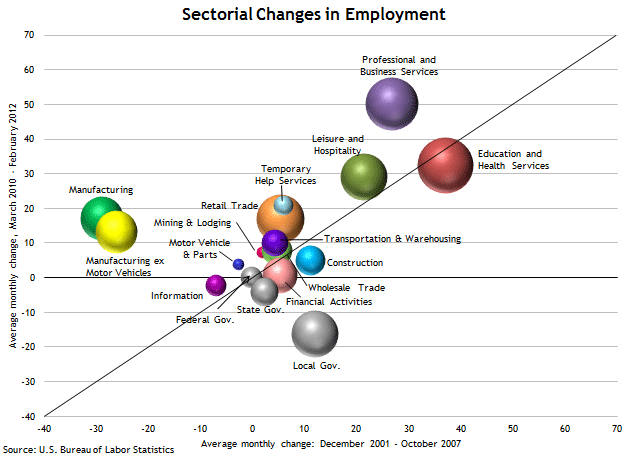
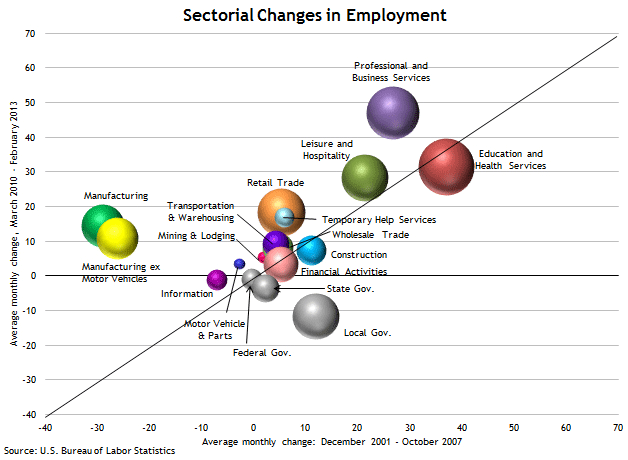
About a year ago, we provided a graphical illustration of postrecession employment patterns using payroll-employment “bubble charts.” These charts measure postrecession average monthly employment changes by sector relative to the changes in the prerecession period from December 2001 through October 2007. Not a lot in that chart has changed over the intervening year (just as not a lot had changed in 2012 compared with 2011):
(click to enlarge)
(click to enlarge)
(click to enlarge)
The stability in the employment picture across private industries, both relative to one another and relative to the precrisis pace of job gains, is just as notable as the changing fortunes of private versus public employment. In fact, the charts offer some pretty clear impressions:
- Virtually all private-sector industries have moved into positive employment-growth territory. That movement includes the construction and financial activities sectors, which have generally lagged the improvement in the rest of the economy. The only broad category still shedding jobs in the private sector has been the information industry—which includes publishing, motion picture production, telecommunications, data procession, and the like—which was also shrinking in terms of employment over the decade leading up to the financial crisis.
- All of the private-sector bubbles in the charts are now close to, on, or above the 45-degree line, meaning that the average pace of monthly job creation in each sector is near, equal to, or greater than what prevailed during the last recovery.
- As the Reddy piece emphasizes, government employment has been in decline since early 2010, though the government sector as a whole retains its status as the sector with the largest employment share. (The size of the bubbles in the charts above represents the share of employment in each sector at the end of the period for which the graph is drawn.) But the chart also illustrates another key point of the Reddy’s article: To date, the decline in government employment has been concentrated in state and, especially, local government jobs. Until recently, jobs creation by the federal government, which is relatively small in the bigger scheme of things in any event, have not deviated much from the prerecession pattern.
The last point brings us to this observation, from the WSJ article:
How the rest of the private sector responds to a shrinking of the federal government could play a bigger role in determining how the budget fight hits the workforce.
“The private sector in the U.S. is growing so much stronger than anyone had expected,” said Bernard Baumohl of the Economic Outlook Group. “This organic growth is going to significantly offset the effect of the sequester in terms of economic output and employment.”
It is worth pointing out that the monthly average of 17,000 state, local, and federal government jobs lost since March 2010 has been nearly matched by average monthly increases of better than 14,000 jobs in manufacturing, a sector that persistently shed jobs in the previous recovery. The replacement of private- for public-sector employment has been sufficient to generate 175,000 to 185,000 net jobs per month in both 2011 and 2012. To put one perspective on that figure, at current labor force participation rates (along with some other assumptions and caveats), that pace would be sufficient to reach the Federal Open Market Committee’s 6.5 percent unemployment threshold by sometime in spring 2015 (as you can verify yourself with the Atlanta Fed’s Jobs Calculator). That calculation raises the stake somewhat on the matter of how “the rest of the private sector responds.”
Disclaimer: This page contains affiliate links. If you choose to make a purchase after clicking a link, we may receive a commission at no additional cost to you. Thank you for your support!


Leave a Reply