The EIA last week released a nice summary of planned additional U.S. pipeline capacity.
The reversal of the Seaway Pipeline began last May to carry 150,000 b/d of crude oil from Cushing, Oklahoma to refineries near Houston. Last month the capacity was increased to 400,000 b/d, and a second pipe twinning the first is expected to bring the total capacity up to 850,000 b/d by 2014:Q1. At the same time, TransCanada expects the Gulf Coast portion of its Keystone Project to be completed by the end of this year with the capacity to transport an additional 700,000 b/d. Six other projects are planned or under construction that would bypass Cushing and could carry an additional 355,000 bbl/d from west Texas directly to the Gulf Coast by the end of this year, with 478,000 b/d added to that in 2014. Yet additional new projects will help transport new production from eastern Texas to the Gulf.
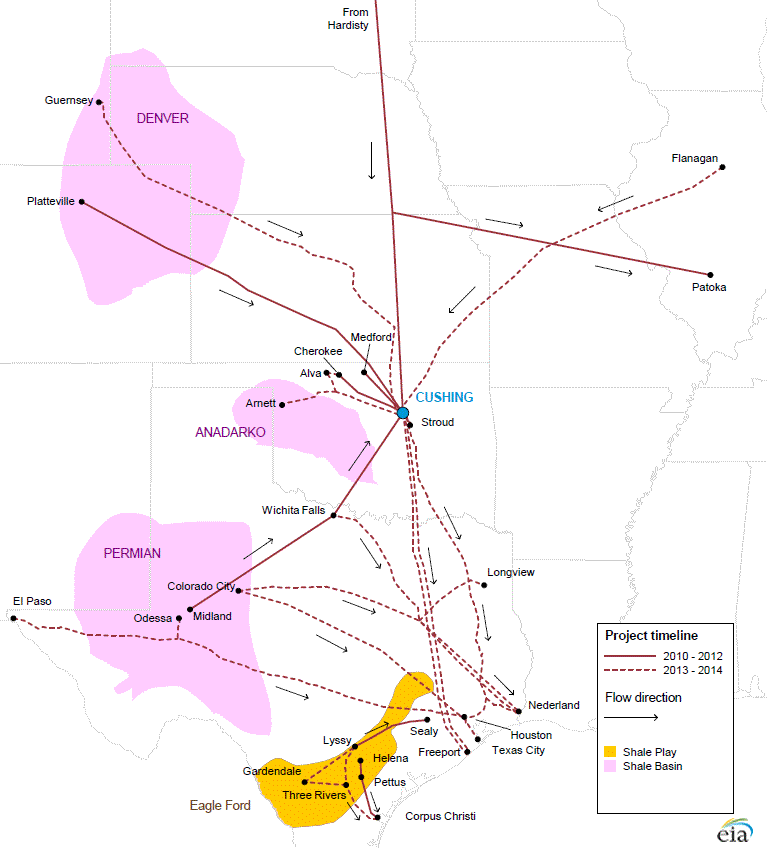
(click to enlarge)
Will all this new capacity relieve the surplus at Cushing? It’s an impressive amount of new capacity to take oil out of Cushing, but even more has been coming in. The EIA offers this summary:
In sum, over the past three years, 815,000 bbl/d of new pipeline capacity delivering crude oil to Cushing was added. Over the same period, only 400,000 bbl/d of new pipeline take-away capacity was added. During the next two years an additional 1,190,000 bbl/d of pipeline capacity for delivering crude oil from Canada and the midcontinent to Cushing is planned, but this is balanced by 1,150,000 bbl/d of planned pipeline capacity additions to deliver crude oil from Cushing to the Gulf Coast. In addition, about 830,000 bbl/d of new pipeline capacity is planned to move crude oil directly from the Permian Basin to the Gulf Coast, avoiding the congested Midwest. If this capacity is constructed and fully utilized, waterborne imports to the U.S. Gulf Coast, particularly of light sweet crude oil, could drop significantly.
Eventually we should get enough capacity to narrow the Brent-WTI spread, but given the above it could take a while. Futures markets seem to be anticipating that Brent will decline a little faster than WTI over the next four years, but with an $8 spread still remaining by the end of 2017.
Solid blue: price of Brent crude oil, dollars per barrel, weekly Jan 7, 2000 to Feb 8, 2013. Dashed blue: price of Brent crude oil futures contracts as of Feb 16, 2013 for April 2013 through Dec 2017. Red: price of WTI. Data sources: EIA and TradingCharts.com [1], [2].
Spread between Brent and WTI, dollars per barrel (solid = historical spot, dashed = current futures prices).
Disclaimer: This page contains affiliate links. If you choose to make a purchase after clicking a link, we may receive a commission at no additional cost to you. Thank you for your support!


Google the “$2.5 Trillion Oil Scam – slideshare” and google the “Global Oil Scam.” The US is a victim of this scam. The speculators and the traders control and manipulate the oil markets, the oil supply-chain and the oil prices. Plug your electric car into your household, solar power battery.