Those who have been told that oil production is booming may be wondering why the prices of oil and gasoline are climbing again.
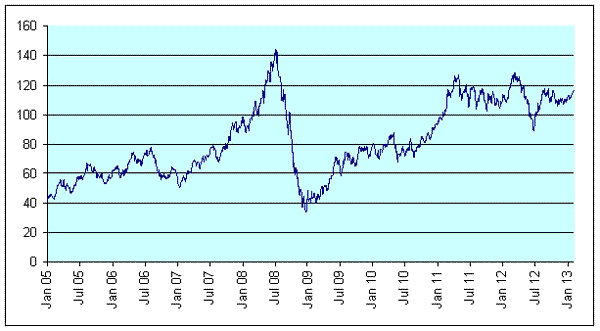
Price of Brent crude oil, dollars per barrel, daily, Jan 4, 2005 to Feb 5, 2013. Data source: Quandl.
According to the EIA, world petroleum production in the first 10 months of 2012 averaged 88.8 million barrels a day. That’s 2 mb/d, or 2.3%, higher than in 2010. The IMF estimates that world GDP grew by 7.1% between 2010 and 2012. If we used a global income-elasticity for petroleum demand of 0.75, we might have anticipated that a 5.3% increase in petroleum production over the last two years would have been necessary to keep the price of oil from rising. Ongoing conservation, for example, in the form of continued improvement in fuel economy, has been a key factor keeping the oil price from rising more in the face of world income growing much faster than world oil production.
China likely consumed nearly half of the global 2 mb/d increase. The EIA reports that China increased its petroleum consumption by almost 500,000 b/d in 2011, and preliminary estimates are that China added another 420,000 barrels to its daily consumption in 2012.
Moreover, about a quarter of the 2 mb/d supply increase reported by the EIA over the last two years came in the form of natural gas liquids. These hydrocarbons are in gas form at ambient pressure and temperature, but become liquid with less pressure than is required to liquefy single-carbon methane.
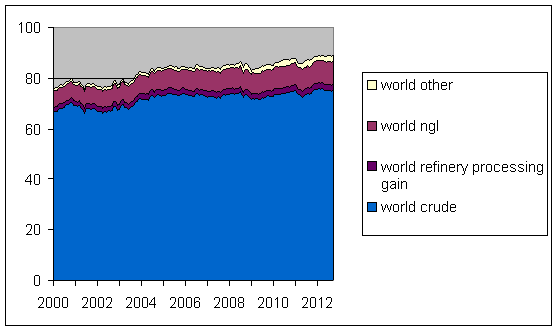
Components of total world oil supply, monthly, January 2000 to March 2012, in millions of barrels per day. Blue: crude oil including lease condensates; purple: refinery processing gain; brick: natural gas plant liquids; yellow: other liquids. Data source: EIA.
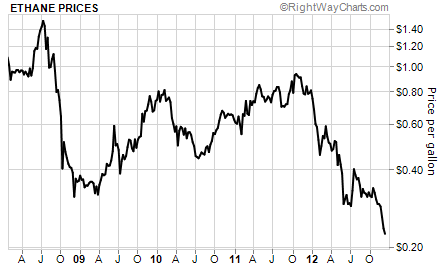
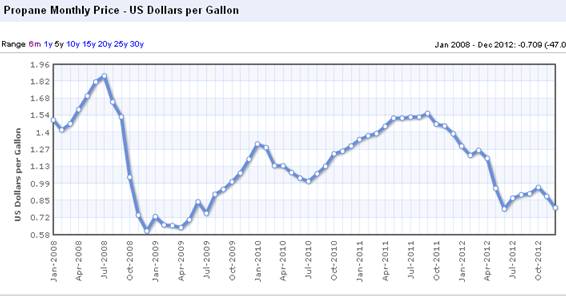
About 80% of natural gas plant liquids are in the form of 2-carbon ethane or 3-carbon propane. Ethane is primarily used to make ethylene for petrochemicals and manufacturing, while propane has a variety of uses. But neither ethane nor propane is used to make gasoline. That’s why the boom in production of NGL’s has meant rapidly dropping prices for ethane and propane but not for the price of gasoline.
Source: Growth Stock Wire.
Source: IndexMundi.
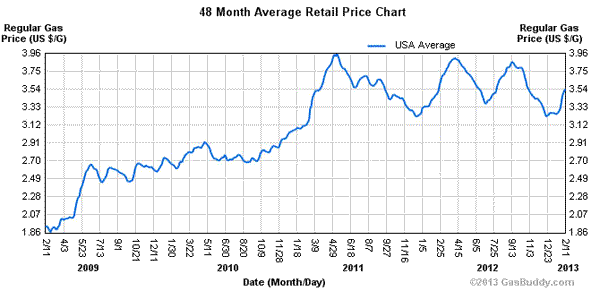
New Jersey Historical Gas Price Charts Provided by GasBuddy.com
It’s obvious from the above price charts that it makes no economic sense to add gallons of ethane or propane to gallons of crude oil to try to summarize global oil supply. But growth of natural gas liquids has been a key factor in the reported increases in “world oil supply” over the last few years and is also a key component of recent optimistic assessments of future oil production by Leonardo Maugeri and the IEA.
There is no question that the boom in production of natural gas liquids is providing a great benefit to industrial users of ethylene. But if you’re waiting for it to lower the price you pay for gasoline at the pump, you may have to wait a while longer.
Disclaimer: This page contains affiliate links. If you choose to make a purchase after clicking a link, we may receive a commission at no additional cost to you. Thank you for your support!


Leave a Reply