With the stock market setting new 5-year highs, I was interested to take another look at some of the long-term fundamentals underlying equity values.
On the one hand, I’m expecting the real economy to be doing better in the second half of the year than it is right now, and inflation and interest rates to remain low through the end of the year. All of that should be bullish for stocks.
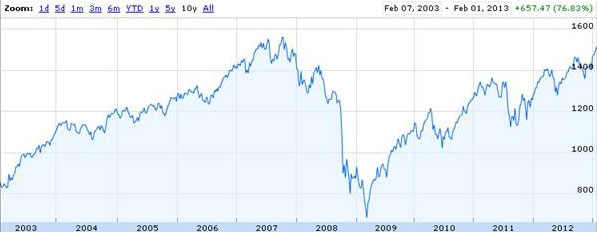
S&P500. Source: Google Finance.
But the question is, how much of that good news is already priced in? Below is an update of one of the graphs from Yale Professor Robert Shiller’s very long-term data set to which I’ve often referred. The green line is a price-earnings ratio on the S&P500 or earlier counterparts. So as not to overstate the impact of temporary spikes up or down in earnings, Shiller relates the current inflation-adjusted stock price to the previous ten-year-average of inflation-adjusted earnings. That backward-looking P/E currently stands at 22.8, well above its average value of 16.5 in data going back to 1880.
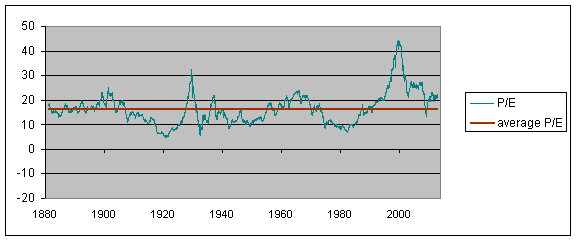
Green line: Ratio of real value of S&P composite index to the arithmetic average value of real earnings over the previous decade, January 1880 to Jan 2013. Red line: historical average (16.5). Data source: Robert Shiller.
If the ratio of prices to historical dividends is unusually high right now, and if you expect the ratio to revert to more typical values, it suggests that you should expect a lower capital gain on stocks you buy today compared to what you would have earned if you bought at a time when the P/E was at or below its historical average. The blue line in the graph below shows the annual rate of return you would have earned by buying stocks at any indicated date and holding on to them for the next decade. That line stops in January 2003, because we don’t yet know what the 10-year return of a stock purchased in February 2003 will turn out to be, and we certainly don’t know what the 10-year return on a stock purchased in February 2013 is going to be. But what we do know is that in the historical record, you did indeed tend to earn a lower return on stocks if you bought them at a time like today when the P/E is relatively high.
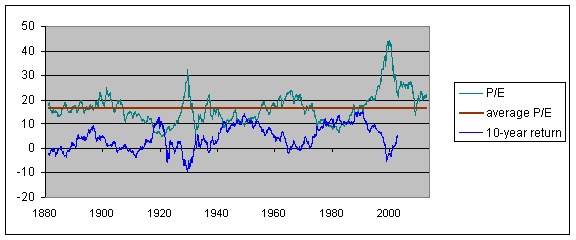
Green line: Ratio of real value of S&P composite index to the arithmetic average value of real earnings over the previous decade, January 1880 to Jan 2013. Red line: historical average (16.5). Blue line: average compounded nominal rate of return on stocks purchased at the indicated date and held for ten years from that date. Data source: Robert Shiller.
But what else are you going to do? Low as the dividend yield is on stocks at the moment (2.04%) , it’s still better than what you can get on a 10-year U.S. Treasury bond. Moreover, any inflation in the prices of the goods and services that firms sell, as well as any profit gains associated with a larger market, should boost those dividends over time, whereas inflation would continue to erode what you make on the Treasury. Or you might look at a Treasury Inflation Protected Security, whose coupon will rise with the headline CPI. That’s currently yielding a hefty -0.57%. Anybody want to sign up for that 10-year plan?
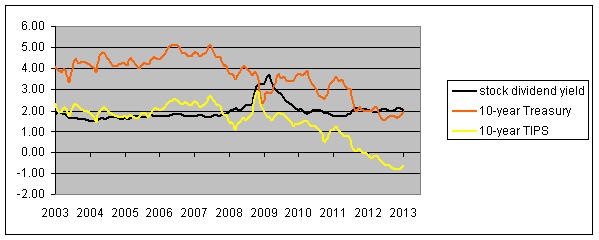
Black line: Ratio of nominal dividend paid on S&P500 two months earlier to current S&P500. Orange line: yield on nominal 10-year Treasury. Yellow line: yield on inflation-indexed 10-year Treasury. Data source: Robert Shiller and FRED.
Or you might consider a real estate investment. Of course you would have made a huge loss on most real estate purchased in 2006.
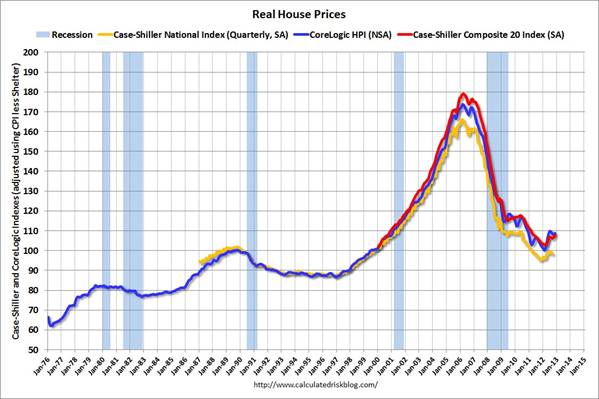
Source: Calculated Risk.
But that’s exactly the attraction of the investment right now. Just as the run-up in stocks makes them a less attractive investment today, in terms the value you’re getting for your investment dollar, the collapse in house prices makes them a more attractive investment today. It’s true that, adjusted for inflation, house prices are still above where they stood in 1980. But with growth in real incomes since then, that might be expected. One can think of the price/rent ratio for houses as similar to a price/dividend ratio for stocks. You can buy property and earn a future income stream from the rental income, or you can buy a stock and earn a future income stream from the dividend income. And the price/rent ratio at the moment is not that out of line with its pre-bubble historical average.
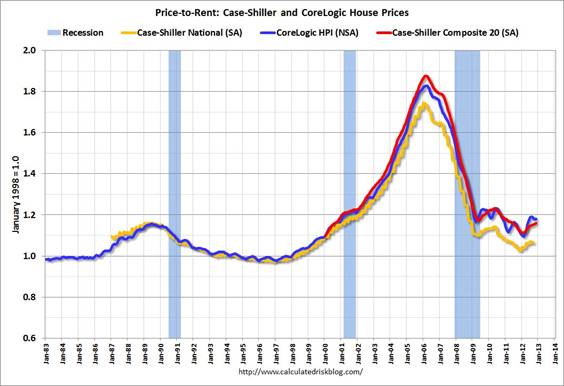
Source: Calculated Risk.
The question is maybe not what is a good investment right now, but instead what is the least bad investment.
Disclaimer: This page contains affiliate links. If you choose to make a purchase after clicking a link, we may receive a commission at no additional cost to you. Thank you for your support!


Leave a Reply