Here are two maps for those trying to follow the U.S. presidential election.
Real Clear Politics calculates an average of recent polls for each state, on the basis of which they create the following map. They designate a state as “toss-up” if the candidate leads in the polls by 5% or less. For example, they’re describing Michigan as a toss-up, even though President Obama leads in their poll average by 48.6% to 43.6%.
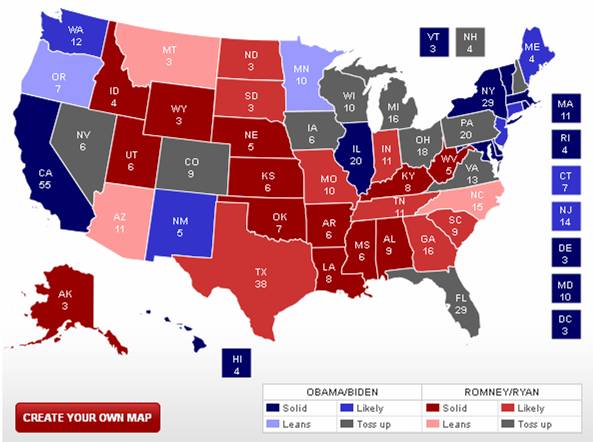
Source: Real Clear Politics.
Alternatively, Intrade summarizes the current prices of their betting contracts on the outcome of each state, summarized in the map below. They call a race a “toss-up” if the implied probability of a victory is 55% or lower. According to the prices of their contracts, the race all comes down to Ohio. 270 electoral votes are needed to win the election. If you color Ohio blue in the map below, Obama gets to 277 electoral votes.
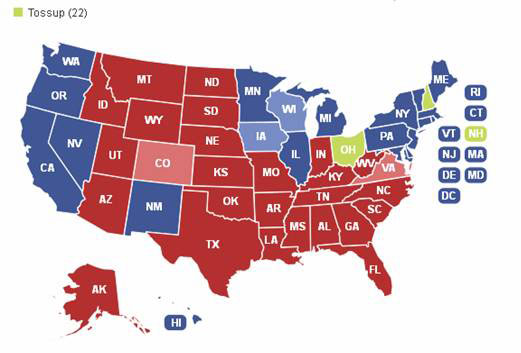
Source: Intrade.
No Republican has ever won the U.S. presidency without carrying Ohio. The RCP poll average currently has Obama up 47.6 to 45.7 there. If you follow the link to the Intrade map, you’ll see it updated every 60 seconds– Ohio’s been shifting back and forth between green and pale blue as I’ve been writing this post.
Disclaimer: This page contains affiliate links. If you choose to make a purchase after clicking a link, we may receive a commission at no additional cost to you. Thank you for your support!


Leave a Reply