Larry White wants to know why Market Monetarists still think there is an excess money demand problem:
Scott Sumner told us in September 2009 that “the real problem was nominal,” that is, the recession and its high unemployment were primarily due to an unsatisfied excess demand for money (combined with real effects on debt burdens of nominal income being below its previous path)…Market Monetarists who have been celebrating the Fed’s recent announcement of open-ended monetary expansion (“QE3′) seem to believe that Sumner’s 2009 diagnosis still applies. But what is the evidence for believing that there is still, three years later, an unsatisfied excess demand for money? …If the evidence for thinking that there is still an unsatisfied excess demand for money is simply that we’re having a weak recovery, then as Eli Dourado has pointed out, this is assuming what needs to be proved.
Larry’s question is understandable since it has been so many years since the crisis first erupted. George Selgin, Steve Horwitz, Eli Dourado, Tyler Cowen, and others have raised this objection before so it is a common one. This objection, however, is unwarranted since there is plenty of evidence that there still remains excess money demand. Before presenting the evidence, there are several points worth noting in this debate.
First, there have been developments other than the U.S. economic collapse of 2008-2009 that have affected money demand over the past four years. While the 2008-20009 collapse was the most important one, there has also been the Eurozone crisis of 2010-present, the debt ceiling talks of 2011, and numerous other lesser events (e.g. robo-signing crisis) that have kept economic uncertainty peaked and thus money demand elevated. In other words, there have been a series of negative money demand shocks that have have compounded the initial money demand shock. Questioning why there hasn’t been enough time to satiate money demand ignores these developments.
Second, when considering money demand shocks it is important that we do so with the appropriate measure of money. Thanks to the work of Gary Gorton (2008), Wilmot et al. (2009), Sing and Stella (2012), and others we now know that what is used as money is far broader than the standard measures. The widely used M2, for example, is limited to retail money assets like cash and deposits accounts that are used by households and small businesses. Institutional investors also need assets that facilitate transactions, but the assets in M2 are inadequate for them given the size and scope of their transactions. Consequently, institutional investors have found ways to make assets like treasuries, commercial paper, repos, GSEs and other safe assets serve as their money. These institutional money assets, therefore, should also be considered part of the money supply. Thus, while M2 might reveal insights on money demand shocks for retail investors it does a poor job shedding light on money demand shocks by institutional investors. This understanding implies that the so called demand for safe assets is really demand for money assets. Interestingly, FA Hayek understood this point many years ago.
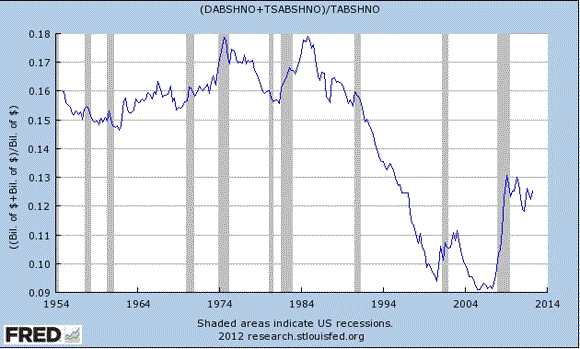
With that said, let’s jump into the evidence. First, household portfolios are still inordinately weighted toward liquid assets. Take a look at the figure below. It comes from the flow of funds data and show households’ total deposit assets and treasuries as a percent of total household assets. There is a sudden jump in this series in 2008 that has yet to return to pre-crisis levels, a sure sign of elevated money demand. Were monetary policy truly loose and raising certainty about expected future nominal income this series would show a sustained decline. Households would rebalance their portfolios away from liquid assets to higher yielding risker assets. The fact that it has not happened indicates there is still an excess money demand problem. (Yes, there seems to a be structural change in household preferences for liquid assets over the 1990s, but this doesn’t change the cyclical story being told here. It only reinforces it)
Most of the growth in household’s liquid assets comes from growth in saving and time deposits. As seen in this figure, the demand for these assets sharply increases with the crisis in 2008 and has yet to subside. This response makes sense since these are the highest yielding FDIC-protected money assets. Households are still demanding safe assets. This surge in money demand explains why M2 has grown so sharply recently, a development noticed by the Fed late last year.
As noted above, however, M2 only measures retail money assets. A more thorough measure that reflects both retail and institutinoal money assets is the M4 divisia measure from the Center for Financial Stability. Whether one looks at the absolute level of this series, its value relative to trend, or relative to a theoretical optimal amount it shows a shortage of money assets. Below, I show the latter by reproducing a chart from an earlier post. Here, I follow Michael Belongia and Peter Ireland by solving for the optimal amount of M4 divisia by plugging in potential nominal GDP (as estimated by the CBO) and actual trend money velocity (as estimated by the Hodrick-Prescott filter) into the equation of exchange (i.e. M*t= NGDP*t/V*t ). Note that CBO’s estimate of potential nominal GDP actually shows a decline so this is a conservative estimate:
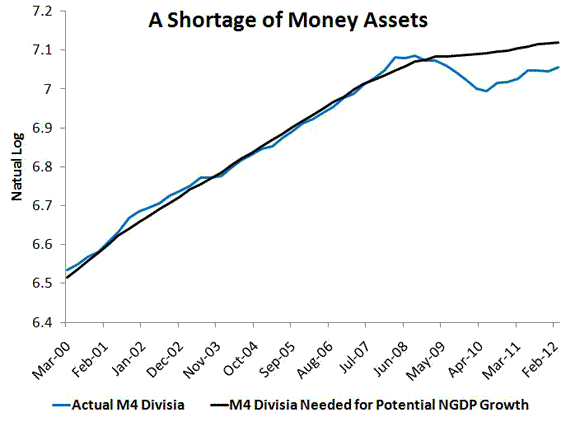
This figure indicates there is still a shortage of money assets and thus, an ongoing excess money demand problem.
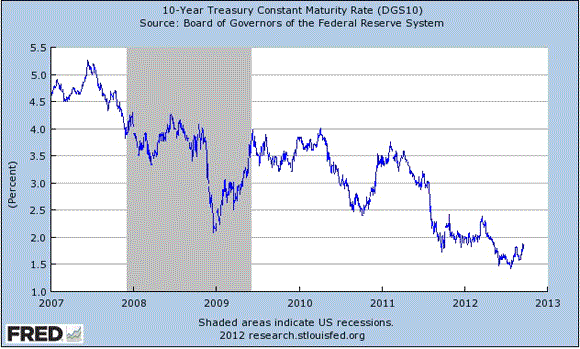
Finally, further evidence on excess money demand can be seen in long-term interest rates. As seen below, long-term interest rates have gone from just over 5% at the start of crisis to around 1.5%. Since the Fed is not the biggest purchasers of treasuries over this time–it is foreigners and private individuals–it cannot be the case that the Fed is an important factor pushing these rates down. Even studies that look at the large scale asset purchases attribute at most about a 1% reduction in long-term interest rates. Consequently, interest rates are low because of ongoing economic weakness that has decreased the demand for credit. Excess money demand is at the heart of this slump. If money demand were not elevated and the public expected higher nominal incomes these interest rate would be rising. The fact they haven’t speaks volumes to the ongoing demand for safe assets or money.
It is hard to believe we have been in this slump since mid-2008. That is a long stretch and one would think enough time for money demand shocks to work themselves out. But the U.S. economy has been subject to a spate of money demand shocks and the Fed has consistently failed to fully respond to them. This is why we have Bernanke’s Little Depression. And it is why we now need a full-fledged and explicit NGDP level target.
P.S. Households continue to expect their incomes to remains depressed. This is another reason to believe money demand is still elevated.
Disclaimer: This page contains affiliate links. If you choose to make a purchase after clicking a link, we may receive a commission at no additional cost to you. Thank you for your support!

Leave a Reply