We know the glass is both half empty and half full. But the real question is whether liquid is being added in or draining out.
Calculated Risk had been calling attention to Doug Short’s graphical demonstration that the 2007-09 bear stock market was worse than those of 1973 and 2000 and comparable to the first year and a half of the Great Depression.
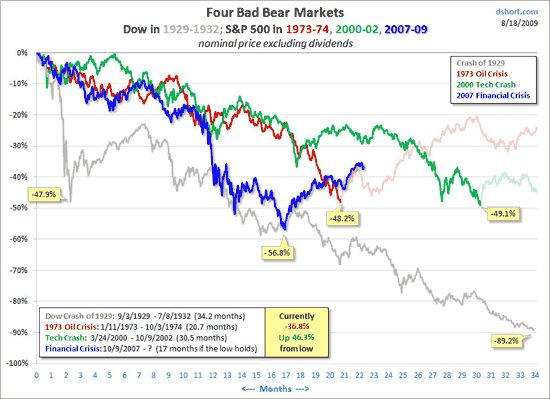
S&P500 after peaks in 1973 (red), 2000 (green), and 2007 (blue), with Dow post-1929 peak in gray. Source: dshort.com.
With the remarkable stock-market surge since March, that unfortunate sense of deja vu had seemed to be behind us. But now Short is suggesting that we align the March 2009 bottom with what proved to be a temporary low at the end of 1929, inviting the interpretation that we’ve just turned down on a long, long descent.
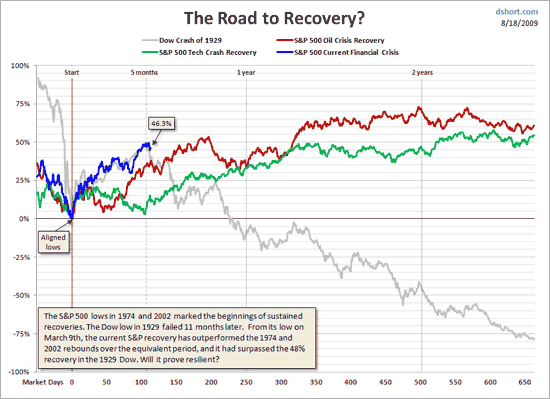
Stock indexes aligned by local trough rather than peak. Source: dshort.com.
Among the factors that turned the hoped-for recovery of 1930 into the debacle of the Great Depression were a sharp hike in interest rates in October 1931 and a decline in the overall price level of 10% per year in 1931 and 1932. Whatever else happens, I don’t expect those particular mistakes to be repeated by the Bernanke Fed.
But let us at least agree on this much– stock prices can go down as well as up.
Disclaimer: This page contains affiliate links. If you choose to make a purchase after clicking a link, we may receive a commission at no additional cost to you. Thank you for your support!

Leave a Reply