Three decades ago, 15% of American adults were obese. Today 35% are. Obesity has increased in many other rich nations too. Why?
Although we burn fewer calories now than in the past, reduced physical activity likely played only a minor role in obesity’s rise. Instead, the main cause was a sharp increase in the number of calories we consume. Why did that happen? The most common story focuses changes in the supply of food. Tasty, high-calorie food became cheaper and more easily accessible in larger quantities, so we began eating more of it.
In the past several years some researchers have advanced an alternative hypothesis that blames rising income inequality and/or economic insecurity (see here, here, here, here). These are said to increase stress, which in turn prompts overeating. How well does this square with the evidence?
Over time in the United States
Begin with the over-time trend in the United States. The obesity rate was flat in the 1960s and 1970s and then shot up in the 1980s. The timing fits for income inequality, which has increased significantly since the 1970s. Economic insecurity, too, has risen during this period, though I’m not sure its increase has been large enough to have produced the massive jump in obesity that occurred.
Note that for the over-time story to work, we need to assume little or no time lag. There was a large rise in obesity during the 1980s. Income inequality and economic insecurity began to rise in the late 1970s at the earliest. If it takes a long time for them to have an impact on obesity, they probably can’t have caused the 1980s obesity increase.
Given that for both hypotheses the key mechanism is stress, we might ask whether stress has increased, and whether the timing fits with the rise in income inequality, economic insecurity, and obesity. None of the research I’ve seen looks into this, but some cite a paper published a decade ago that finds evidence of a rise in anxiety in the U.S. Curiously, though, that study concluded that anxiety rose steadily from the 1950s through the early 1990s. This doesn’t match up well at all with the over-time trends in income inequality, economic insecurity, or obesity.
Across the rich countries
The chief empirical evidence cited in support of the income inequality and economic insecurity hypotheses is the pattern across affluent countries. However, there’s a problem with the country-level obesity data. In most of these nations the only available data are from interviewees’ self-reports of their height and weight, which are likely to underestimate the true obesity rate. If the degree of bias is similar in all countries, this wouldn’t pose much of a problem for an analysis of cross-country differences. But we don’t know whether the bias is similar across countries or not.
The following chart shows the data we have for the late 2000s. For a few countries — the U.S., Australia, Canada, Ireland, and Finland — there are obesity estimates both from self-reports and from actual measurements of people’s height and weight. The latter are likely to be quite accurate. In each of these five countries the obesity rate based on self-reports is lower. But in the U.S., Canada, and Ireland it’s quite a bit lower, whereas in Finland it’s somewhat lower and in Australia it’s only slightly lower.
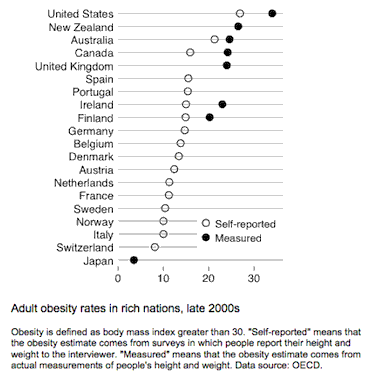
This leads me to worry a good bit about the degree of bias for many of the countries. It’s certain that that the U.S. has the highest obesity rate and that Japan has the lowest. But apart from those two nations it’s difficult to be confident. In almost all of the other countries, the obesity rate according to the self-reported data is within a fairly narrow band, between 10% and 16%. Maybe these countries’ true obesity rates line up in the same way they appear in the chart. But maybe not. Bottom line: we should be very cautious in drawing inferences from the cross-country data.
Okay, with that caveat, what does the cross-country evidence suggest? Let’s start with the simple cross-section. (I’ll come to over-time patterns in a moment.) The next chart shows the association between obesity and income inequality as of the mid-to-late 2000s. I’ve used obesity rates based on self-reports for most of the countries and the true rate minus a few percentage points for the others. As the solid line indicates, the association is positive; nations with higher income inequality tend to have higher obesity rates.
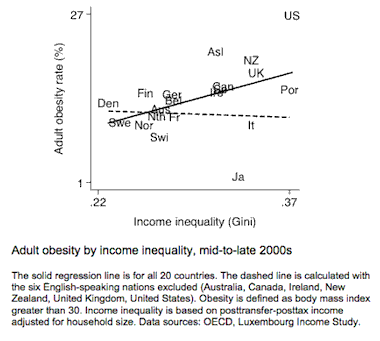
But the positive association is driven entirely by the group of six English-speaking nations in the upper-right portion of the chart: Australia, Canada, Ireland, New Zealand, the United Kingdom, and the United States. If we exclude them, the association disappears entirely (dashed line). That’s not due to lack of variation in income inequality among the remaining nations. The Nordic countries are well over to the left with low inequality, while Portugal, Spain, Italy, and Japan are well over to the right. But there is no relationship between income inequality and obesity among these 14 non-English-speaking countries.
Maybe there’s something about the English-speaking nations, other than high income inequality, that has resulted in high obesity. Here is where the economic insecurity hypothesis comes in. In a recent paper in the journal Economics and Human Biology, Avner Offer, Rachel Pechey, and Stanley Ulijaszek write “Among affluent countries, those with market-liberal welfare regimes (which are also English-speaking) tend to have the highest prevalence of obesity. The impact of cheap, accessible high-energy food is often invoked in explanation. An alternative approach is that overeating is a response to stress, … that market-liberal countries have an environment of greater economic insecurity, and that this is the source of the stress that drives higher levels of obesity.” Offer and his colleagues conclude that economic insecurity is a good predictor of the cross-country variation in obesity, much better than income inequality.
I suspect it’s true that the English-speaking countries tend to have more economic insecurity than other rich nations. But I have limited faith in the insecurity measures Offer and his coauthors use in their analyses. To be economically secure is to have sufficient resources to cover one’s expenses. Economic insecurity is a product of low income, of significant income decline coupled with lack of private or public insurance and lack of assets, or of inadequate insurance to head off large unexpected expenses. At the moment I don’t think we have an especially valid and reliable measure of economic insecurity for cross-country analysis.
What do the over-time patterns in obesity tell us? They’re shown in the following chart, with data based on measured height and weight shown in solid lines and data based on self-reports shown in dashed lines. Note the similarity between the trend for the U.S. and the trends for Australia, New Zealand, and the U.K. The pace of increase since the 1970s has been about the same in all four of these countries. This suggests that there is indeed something different not just about the United States but about the English-speaking nations as a group.
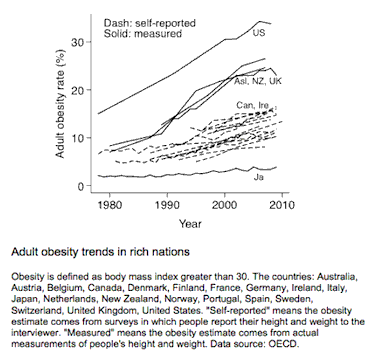
And yet, the differing data sources should give us pause. The data for the other two English-speaking countries, Canada and Ireland, are from self-reports, and their over-time trends look very much like those of the non-English-speaking nations with self-report data. Maybe the apparent difference between the English-speaking countries and other rich countries (apart from Japan) in the pace of obesity’s rise is simply a function of data source. Unfortunately, we can’t be sure.
If the English-speaking countries do in fact stand apart in their obesity rates or trends, there is an alternative hypothesis that ought to be considered. Rather than being driven by income inequality or economic insecurity, it might owe to these countries’ weak regulation of food and restaurants and to their lack of a well-entrenched healthy eating culture. Large-portion restaurants, particularly fast-food ones, may have proliferated more rapidly in the English-speaking nations. Junk food may have become available in grocery and convenience stores sooner and in larger quantities. And the shift away from home cooking and limited snacking may have occurred more quickly and decisively. This strikes me as more plausible than the suggestion that Americans and their counterparts in other English-speaking nations suddenly began eating more due to heightened stress. It’s also consistent with my own anecdotal impressions, though I haven’t seen any hard data.
Offer and colleagues include a measure of the price of a McDonald’s Big Mac relative to per capita GDP. This is likely to capture only part of what I’m referring to, and in their analysis it doesn’t account for much of the cross-country variation. A better measure, though still only a partial one, might be something like the number of restaurants per capita. One study finds that within the United States this correlates strongly with the prevalence of obesity over time.
Across the states
To my knowledge there are no state-level studies of the impact of economic insecurity on obesity, perhaps because we lack good state-level data on economic insecurity. Income inequality has received more attention, and some researchers have concluded that there is a positive association between inequality and obesity across the states (e.g. chapter 7 here).
Obesity data for the U.S. states are available from 1995 to 2010. The data are from self-reports, so here too we should be wary. But we can hope that the degree of bias is similar in each state.
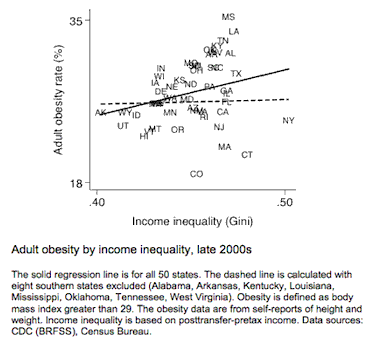
Here is the cross-sectional pattern as of the late 2000s. The predicted positive association is there (solid line). But it is driven by eight southern states in the upper-right portion of the chart: Alabama, Arkansas, Kentucky, Louisiana, Mississippi, Oklahoma, Tennessee, and West Virginia. (Four other deep-south states — Georgia, North Carolina, South Carolina, and Texas — are close by.) Without these states there is no correlation (dashed line). It’s not difficult to think of plausible alternative causes of these states’ high obesity rates, most notably diet.
Indeed, since the states differ in a slew of ways that might affect obesity — from food preferences to education to affluence to physical activity — our best bet is to compare changes over time. If income inequality is an important determinant of obesity, we would expect states in which income inequality has increased most rapidly to have experienced the fastest rise in obesity. Have they? As the next chart shows, the answer is no.
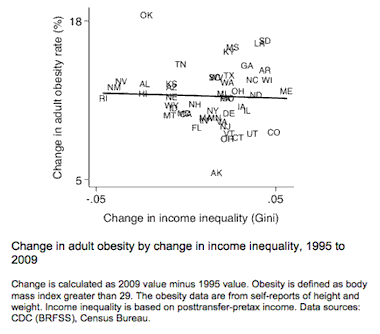
(Two technical details: First, do we need to allow a longer time lag for the effect to show up? Perhaps, but if so the case for inequality as a major contributor to the rise in obesity is, as I suggested earlier, much less compelling. Second, is there a positive association between the level of income inequality in the mid-1990s and subsequent changes in obesity? The answer again is no.)
Now, it’s possible that analyzing the period from the mid-1990s through the late 2000s isn’t very informative. It could be that the strong causal effects are visible only in the 1980s, when the obesity rise began, and patterns since then don’t shed much light. Unfortunately, there’s no way to know, because we don’t have 1980s obesity data for many of the states. What can be said is that given the available data, the case for income inequality as a key determinant looks weak.
Across individuals in the U.S.
Another piece of evidence sometimes cited as supporting the economic insecurity hypothesis is the social gradient in obesity in the United States — the fact that obesity rates have tended to be highest among the poor, those who are least secure economically.
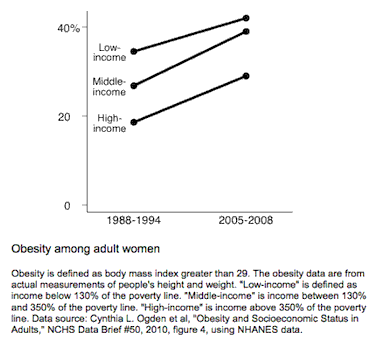
Of course, there are reasons other than stress why poor people might be more vulnerable to obesity, such as less education, less ability to afford healthy food, and less access to such food. Here too, then, it’s helpful to examine changes over time rather than just levels. One potentially useful piece of information is changes in obesity among women after the mid-1990s welfare reform. That reform placed strict time limits on receipt of cash assistance for women with low income. If there is any change in recent decades that ought to have heightened stress among low-income women, welfare reform is it. According to the economic insecurity hypothesis, obesity rates in the period after the mid-1990s should have risen more rapidly among low-income women than among other women.
But that isn’t what happened, as the next chart shows. Obesity rates actually increased a bit more rapidly among middle-income and high-income women than among those with low incomes.
What should we do?
About a third of American adults are obese. Obesity tends to have adverse financial and mental and physical health consequences for these individuals, and it’s estimated to cost the country about 1% of GDP in medical expenses each year. It’s a significant social and economic problem.
What’s the best strategy for reducing obesity? Some scholars have come to believe that reducing income inequality and/or economic insecurity is a key part of the cure. I’m not persuaded that the evidence supports this view. Though there’s a lot of uncertainty due to data limitations, my best guess is that inequality and insecurity have played a minor role, if any, in obesity’s rise.
Disclaimer: This page contains affiliate links. If you choose to make a purchase after clicking a link, we may receive a commission at no additional cost to you. Thank you for your support!


Leave a Reply