This WSJ chart shows last week’s performance of different major global financial markets:
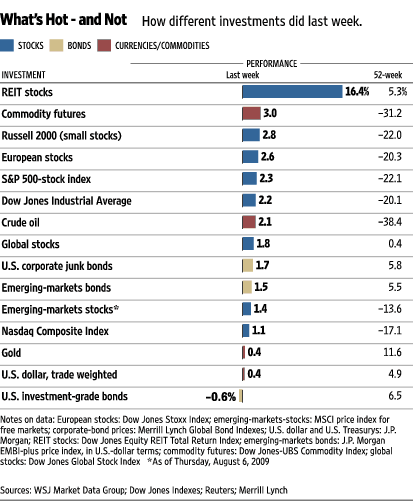
As the chart above illustrates, REIT’s continued to dominate the performance spectrum convincingly over the last week, gaining over 16%. More importantly, REIT’s turned 5.3% positive on a year-over-basis. Russell 2K posted gains as well by adding 3%. Euro Stocks’ came in third with +2.8%.
Excluding greenback’s 0.6 percentage points deterioration, all asset classes gained. On a y/y basis however, the majority of them continue to be in the red with crude topping the list at (-38.4%) but showing improvement from last week’s (-44.5%).
Graph: WSJ
Disclaimer: This page contains affiliate links. If you choose to make a purchase after clicking a link, we may receive a commission at no additional cost to you. Thank you for your support!
Leave a Reply