The Commerce Department reported today that the seasonally adjusted real value of the nation’s production of goods and services fell at a 1% annual rate during the second quarter. That’s about as bad as things ever got during the recession of 2001. But after the -5.4% and -6.4% growth rates that the Commerce Department now says characterized 2008:Q4 and 2009:Q1, some folks are cheering today’s news. Reminds me a little of how I’ve seen people in Minnesota take off their shirts for the first 40oF day of spring, a little shocking to a traveler from San Diego.
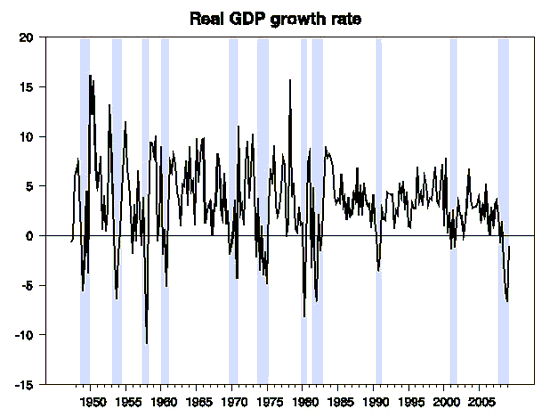
Rate of growth of real GDP (annual rates), 1947:Q2 to 2009:Q2. Shaded regions represent dates of NBER recessions.
On the other hand, our Econbrowser Recession Indicator Index is impressed with just how cold the winter was. This is a pattern recognition algorithm for identifying recessions that waits one quarter for new data and revisions before making a final assessment. Based on the 2009:Q2 GDP numbers just released, the value that the algorithm assigns to the first quarter of 2009 is 99.7, the highest reading since 1980. We’ll declare the recession to be over when the index falls below 33.
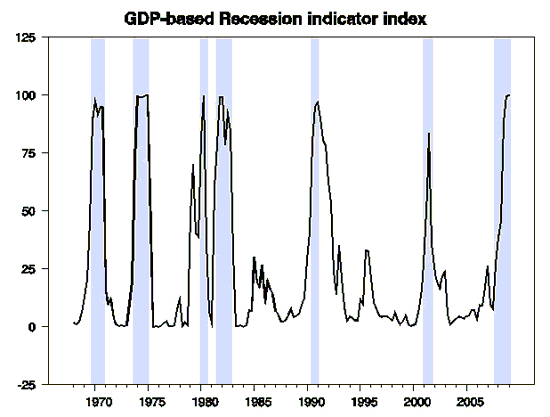
The plotted value for each date is based solely on information as it would have been publicly available and reported as of one quarter after the indicated date, with 2009:Q1 the last date shown on the graph. Shaded regions represent dates of NBER recessions, which were not used in any way in constructing the index, and which were sometimes not reported until two years after the date.
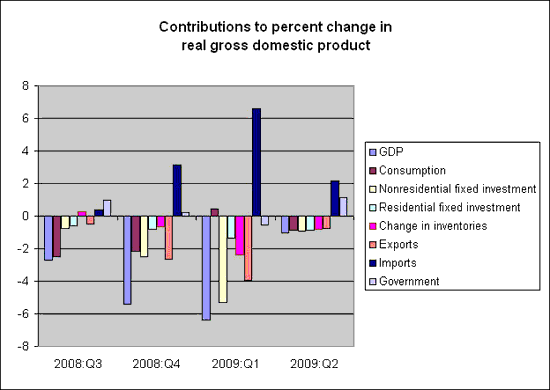
In terms of specific factors contributing to the 2009:Q2 growth rate, consumption spending, housing, nonresidential fixed investment, inventory change, and exports each subtracted almost 1%– had it not been for the positive contribution from falling imports and increasing government spending, the Q2 number would have been -4.3% instead of -1%. Should we be cheering the fact that falling imports were a key factor preventing GDP from declining even more? Falling U.S. imports can create problems for those countries trying to export to us and are a symptom of a very weak U.S. economy. But lower U.S. imports are a necessary element of our longer run adjustment process, and indeed, if the increase in U.S. private saving were just matched by the decrease in U.S. imports, we’d be exactly where we want to be in both the short and the long run.
Of course, we’re not there at the moment, not even close, but I find some things to cheer about in the other components of GDP as well. It would take nothing more profound than for inventories to stop falling for GDP growth to be 1% higher over the next year than it was over the last. Indeed, it’s reasonable to expect inventory rebuilding to make a positive contribution to GDP growth rates for the second half of the year. A similar calculation holds for housing. If the value of new homes built in the second half of the year remains at the same extremely low levels we saw in the first half, the GDP growth rate will be 1% higher. And it looks like home sales could well be higher, not just constant between 2009:H1 and H2.
On the other hand, it’s hard to see nonresidential fixed investment making a positive contribution any time soon.
But by all means, go ahead, take your shirt off. As long as you understand that it’s still plenty cold out there.
Been down so long it looks like up
Disclaimer: This page contains affiliate links. If you choose to make a purchase after clicking a link, we may receive a commission at no additional cost to you. Thank you for your support!


Leave a Reply