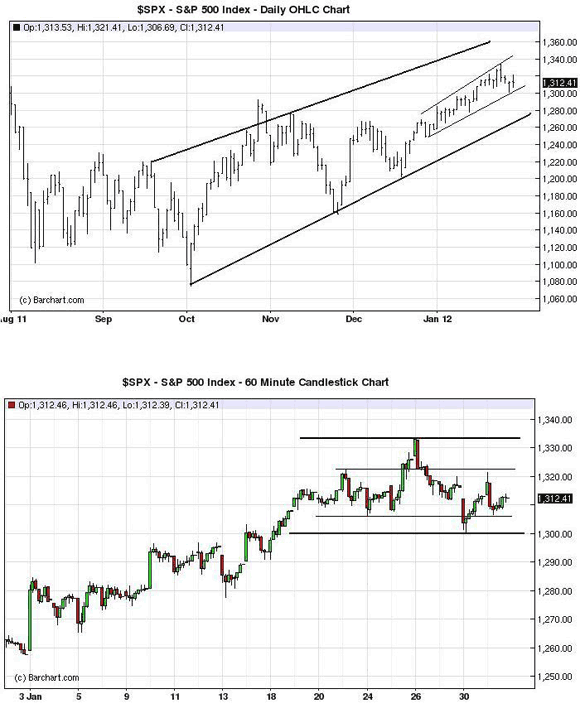
Interesting couple of charts on the S&P500. The top shows the narrowing upward channel in which the index has traded since the beginning of the year relative to the wider medium-term channel. The collapse in volatility was the direct result of the massive liquidity injections of the ECB’s LTRO program, in our opinion.
The second, a 60 minute chart, shows the S&P peaked at 1333 and has been trading poorly since. Also looks like a head and shoulders pattern is forming. We suspect a little pullback is due and is coming.
A move out of the narrow “snake in the tunnel” back to the lower bound of upward channel at 1277 would be extremely healthy for the market going forward. We’re also still watching the Shanghai to confirm the move in other equity markets. It’s been a real a dog since returning from holiday. Stay tuned.
Disclaimer: This page contains affiliate links. If you choose to make a purchase after clicking a link, we may receive a commission at no additional cost to you. Thank you for your support!


Leave a Reply