Since I happen to have handy some regional data on the help-wanted index (HWI) for the U.S., I thought it might be interesting to see whether U.S. vacancy and unemployment dynamics in a cross-section display any interesting patterns. (I would like to thank Kyle Herkenhoff for suggesting this exercise to me).
The regional HWI data is from the Conference Board. I explain here how the data was corrected for the recent substitution from print to electronic media in job advertising activities. That data was constructed for 36 U.S. cities. I construct a “vacancy rate” measure by dividing the HWI by the labor force and normalizing to 10 in 1990:1. Here is what the aggregate data looks like:
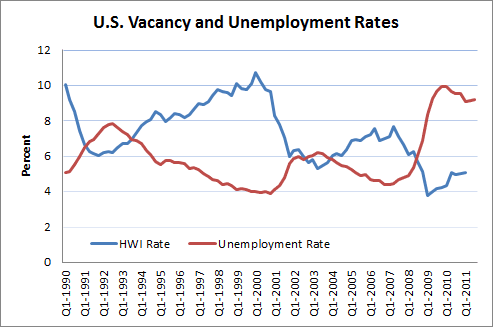
As one would expect, there is a strong negative correlation between vacancies and unemployment; this is the so-called Beveridge Curve.
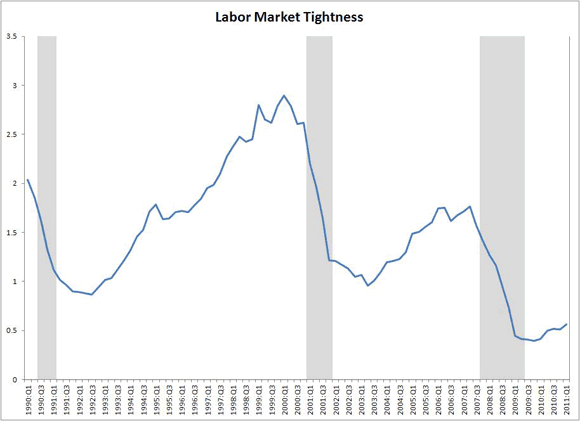
Labor economists sometimes like to gauge labor market conditions by constructing a “labor market tightness” variable–the ratio of vacancies to unemployment, or the v/u ratio. The v/u ratio plays a prominent role equilibrium unemployment theory; see Diamond, Mortensen and Pissarides. As the following diagram shows, labor-market-tightness is highly procyclical.
Regional Patterns
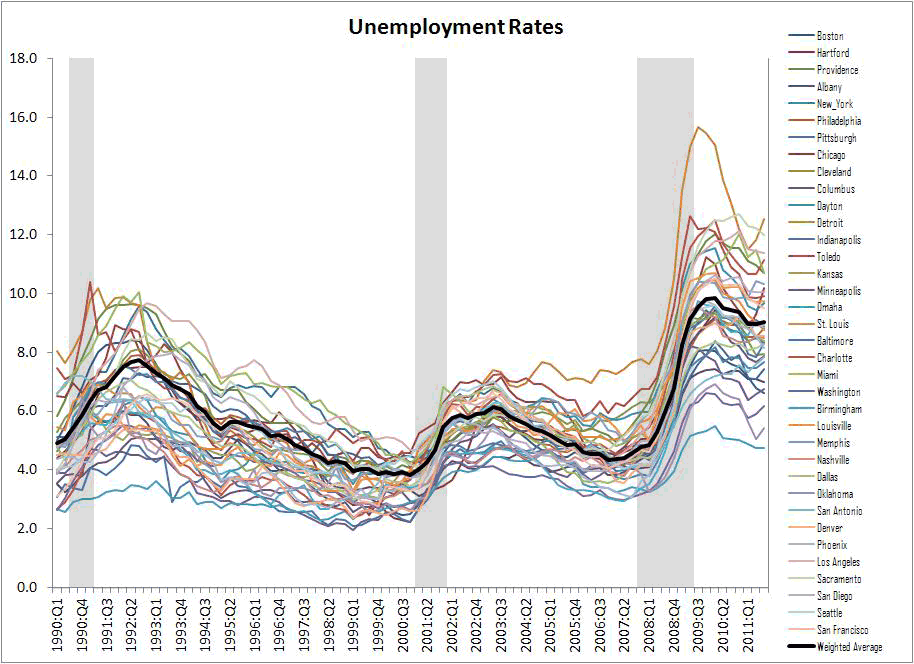
The following diagram plots the unemployment rates for 36 metropolitan areas in the U.S. The solid black line is a population-weighted average (it corresponds to the national unemployment rate).
(click to enlarge)
The figure shows that there is significant disparity in regional unemployment rates at all points in the business cycle. As the U.S. economy emerged from the recession in the early 1990s, regional variation in unemployment rates seems to have declined for the rest of that decade. Nothing much changed until the most recent recession, where we see a dramatic increase in both the average unemployment rate and its in its dispersion across regions.
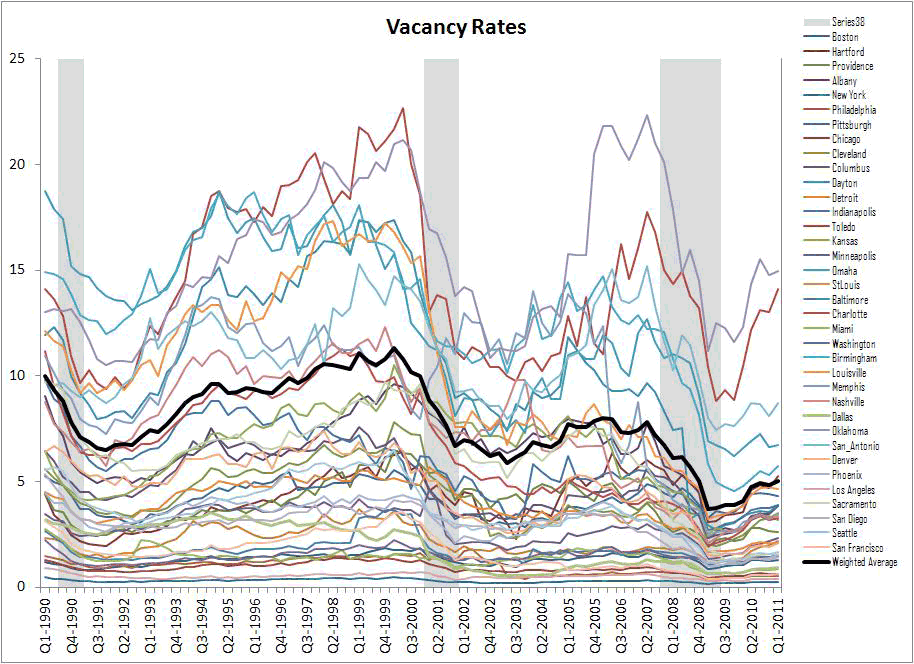
Next, let’s take a look at regional “vacancy rates” (the city-based HWI divided by regional labor force).
(click to enlarge)
The dispersion in regional vacancy rates appears to be very, very large (measurement error?). Using my eyeball metric, it appears that the dispersion in vacancy rates is somewhat procyclical. In particular, look at how the dispersion appears to increase throughout the 1990s expansion–at the same time, the dispersion in unemployment rates is declining. This suggests that the dispersion in labor-market-tightness is procyclical; and indeed, the following diagram shows this to be the case.
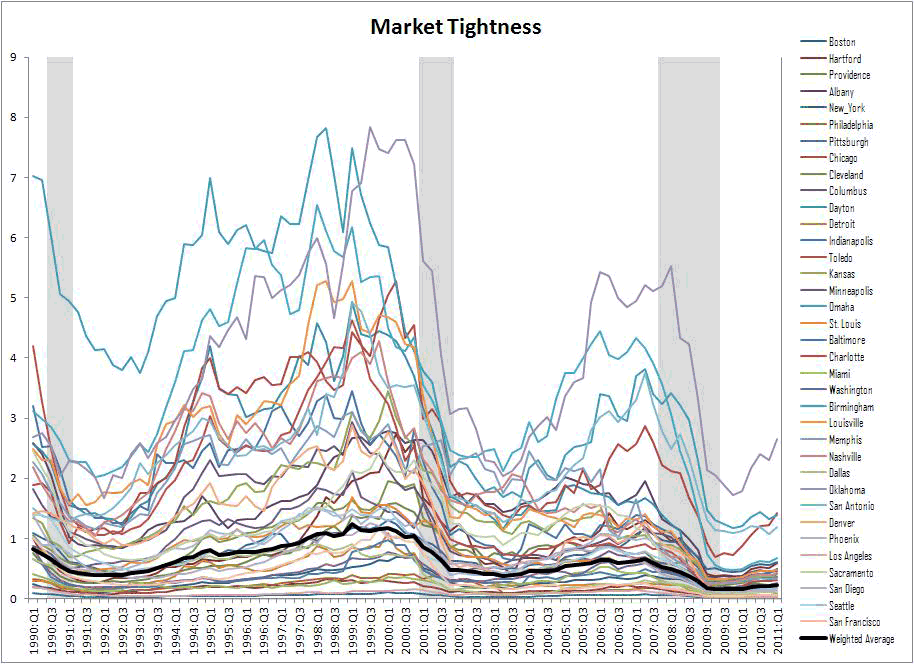
(click to enlarge)
It would be interesting to know what might be behind these regional differences in labor market tightness, and why this regional dispersion varies over the business cycle.
First, what accounts for the dispersion? In a basic Mortensen-Pissarides labor market search model, extended to incorporate regions, I think that the labor-market-tightness variable is likely to equate across regions (at least, allowing for factor mobility). Regional differences in tax rates, etc., might account for some of the disparity. But the measured disparity is huge.
Second, what accounts for the cyclical properties of the dispersion? Is it simply the case that some regions are populated by industries that are more cyclical sensitive to aggregate shocks? Or is it the case that the shocks themselves are concentrated in certain regions, with the effects propagating to other regions of the country?
If anyone would like to see this data plotted in a different way, or see some statistics reported, feel free to let me know. (Thanks to Constanza Liborio for preparing these graphs.)
Disclaimer: This page contains affiliate links. If you choose to make a purchase after clicking a link, we may receive a commission at no additional cost to you. Thank you for your support!


Leave a Reply