This Wall Street Journal chart shows last week’s performance of different major global financial markets.
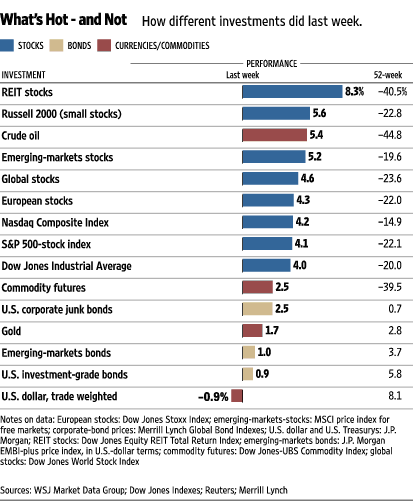
As the chart above illustrates, REIT’s dominated the performance spectrum convincingly over the last week ; gaining over 8%, followed by Russell 2K’s 5.6%. Excluding greenback’s 0.9 percentage points deterioration, all asset classes gained. On a y/y basis however, the majority of them remain in red.
Disclaimer: This page contains affiliate links. If you choose to make a purchase after clicking a link, we may receive a commission at no additional cost to you. Thank you for your support!
Leave a Reply