U.S. monetary policy has gone through three distinct phases since 2008. We may be about to begin the fourth.
I would characterize the period from February 2008 through March of 2009 as the first phase of recent U.S. monetary policy. During this period, the Fed was concerned about the possibility of a full-fledged financial panic, in which no one is sure which financial institutions are going to fail next and as a result nobody is willing to lend to anyone for any purpose. The Fed sought to fulfill its traditional mission of being the lender of last resort, which it implemented through a series of new initiatives summarized in Figure 1 below. The most important of these were currency swaps, the Commercial Paper Funding Facility, and the Term Auction Facility. The Fed also acquired some problematic assets through the Bear Stearns and AIG bailouts, which it has been gradually selling and writing off.
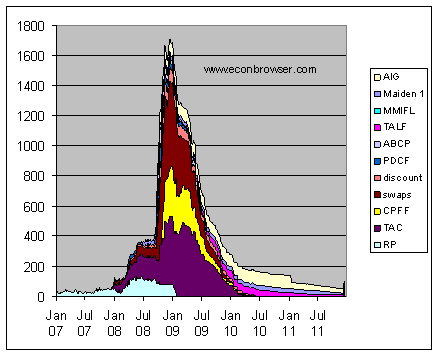
Figure 1. Details of Fed emergency lending, in billions of dollars, seasonally unadjusted, from Jan 1, 2007 to Dec 14, 2011. swaps: central bank liquidity swaps; AIG: sum of credit extended to American International Group, Inc. plus net portfolio holdings of Maiden Lane II and III plus preferred interest in AIA Aurora LLC and ALICO Holdings LLC; Maiden 1: net portfolio holdings of Maiden Lane LLC; MMIFL: net portfolio holdings of LLCs funded through the Money Market Investor Funding Facility; TALF: loans extended through Term Asset-Backed Securities Loan Facility plus net portfolio holdings of TALF LLC; ABCP: loans extended to Asset-Backed Commercial Paper Money Market Mutual Fund Liquidity Facility; PDCF: loans extended to primary dealer and other broker-dealer credit; discount: sum of primary credit, secondary credit, and seasonal credit; CPFF: net portfolio holdings of LLCs funded through the Commercial Paper Funding Facility; TAC: term auction credit; RP: repurchase agreements;
By March of 2009, the threat of financial panic had subsided, but the economy was still in terrible shape. As the emergency lending programs were gradually unwound and closed, the Fed sought to maintain some stimulus by replacing these with purchases of mortgage-backed securities, agency debt, and long-term U.S. Treasury debt. The graph below displays total Fed assets, and shows that the net effect of Phase 2 was to maintain total assets at a fairly steady level through 2009 and most of 2010, even as the emergency lending was phased out. This second phase was often referred to in the financial press as an initial round of quantitative easing, or QE1.
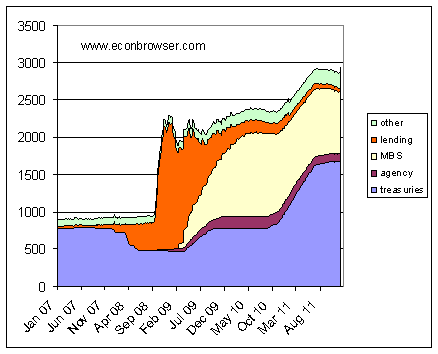
Figure 2. All Federal Reserve assets, in billions of dollars, seasonally unadjusted, from Jan 1, 2007 to Dec 14, 2011. Wednesday values, from Federal Reserve H41 release. treasuries: U.S. Treasury securities held outright. agency: federal agency debt securities held outright; MBS: mortgage-backed securities held outright; other: sum of float, gold stock, special drawing rights certificate account, Treasury currency outstanding, and other Federal Reserve assets; lending: sum of categories in Figure 1 above.
A third phase, popularly dubbed QE2, began in November 2010, as the Fed decided to expand its balance sheet further with additional Treasury purchases. This ended in June of this year, since which total Fed assets have plateaued at a level triple that in the start of 2007.
At the very last data point on each of the above figures (the December 14 totals), the eagle-eyed reader will detect a sharp but significant blip up. This can be seen more clearly in the following graph that focuses on just the last 9 months.
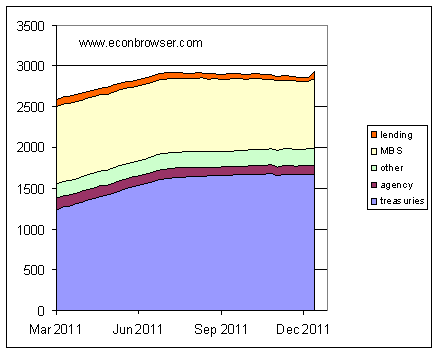
Figure 3. All Federal Reserve assets, in billions of dollars, seasonally unadjusted, from March 2, 2011 to Dec 14, 2011.
The biggest component in last week’s jump in Fed assets was currency swaps. These had been under $2.5 billion since June of 2010 but spiked to $54 billion in the most recent week. That’s still a far cry from the $583 billion in swaps in December 2008, but indicates that the Fed has started to make a significant volume of dollar loans to foreign central banks, which dollars the foreign central banks in turn are lending to private banks. One indication of the strains on interbank Eurodollar lending that this is intended to address is the spread between 3-month LIBOR yields and 3-month U.S. Treasuries. This has continued to climb, though it remains far below levels seen in 2008.
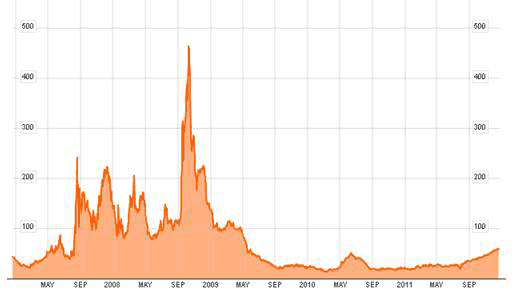
TED spread. Source: Bloomberg.
Another measure of financial stress is the spread between the 3-month Euribor and overnight EONIA rates.
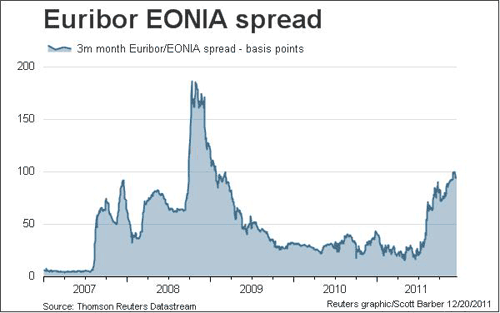
Source: Thomson Reuters.
Zero Hedge also noted an unusual $31 billion surge in Fed MBS purchases last week. This only brings the level of these back up to values in October, but it doesn’t seem to fit the recent pattern of MBS buying. That same article also infers that there was an unusual $2.5 billion one-day loan through the Fed’s discount window on December 13.
Phase 4, then, could turn out to be a return to emergency lending as the Fed tries to contain collateral damage from the unfolding European drama.
European financial tensions and the Fed
Disclaimer: This page contains affiliate links. If you choose to make a purchase after clicking a link, we may receive a commission at no additional cost to you. Thank you for your support!


Leave a Reply