Initial Claims for Unemployment Insurance plunged by 37,000 last week to 391,000. This was far better than the expected level of 419,000. Last week’s numbers were revised upwards by 5,000, so one could see it as a decrease of 32,000. Either way, it is still a big and very unexpected drop.
Recently, initial jobless claims had seemed stuck once again in a trading range above the 400,000 level, after a brief period lower than that earlier this year. This 391,000 level is the lowest since the start of April. In the report, the Department of Labor did not point to any unusual factors, so it is a fairly clean number.
Being — and staying — below 400,000 signals the start of much more robust job growth. If the current level can be sustained or even improved upon (and that is a big IF) this could be signaling much better job growth in September and October.
Unemployment Number
Unemployment held steady at 9.1% in August despite no net job growth. The participation and employment rates actually ticked up ever so slightly, but they were coming off the lowest levels since 1983.
No net jobs, plus an increase in the participation rate, should have equaled an increase in the unemployment rate, but the employment report is composed of two separate surveys. The household survey was much more upbeat in August than was the establishment survey. However, the establishment survey is generally considered the more accurate of the two.
4-Week Moving Average
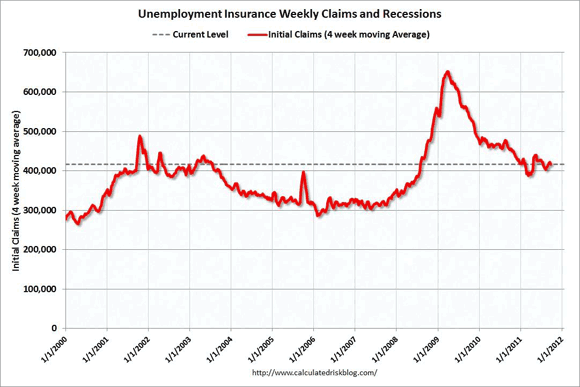
Since claims can be volatile from week to week, it is better to track the four-week moving average to get a better sense of the trend. It fell 5,250 to 417,000. It is still well above the psychologically important 400,000 level, but will drop quickly if this week’s number does not prove to be an anomaly.
While the economy has been technically out of a recession since June of 2009, the recovery has not been very effective at putting people back to work. Corporate profits have recovered nicely, but not jobs. The big question is: can we get below the 400,000 level and stay there? There are a lot of pressures slowing the economy, with a more concretionary fiscal policy at all levels of government at the top of the list.
The economy is growing but very slowly, and while private sector job growth in the first eight months of this year are almost double the job gains of the first eight months of 2010 (1.162 million vs. 626,000), it is not enough to put a dent in the huge army of the unemployed. Those gains have been offset by a faster pace of government layoffs (290,000 vs. 73,000).
The August employment report was worse than expected, and even worse than the back to back disasters that were May and June. In August, the private sector created just 17,000 jobs, offset by the loss of 17,000 government jobs.
The unemployment rate was unchanged at 9.1%, but the employment rate, or the percentage of the population over age 16 actually working, rose to 58.2% from 58.1% in July. The increase was good to see, but July was the lowest level since 1983 — when the movement of women into the labor force was not yet complete.
The first graph (from this source) shows the long term history of the four week average of initial claims.
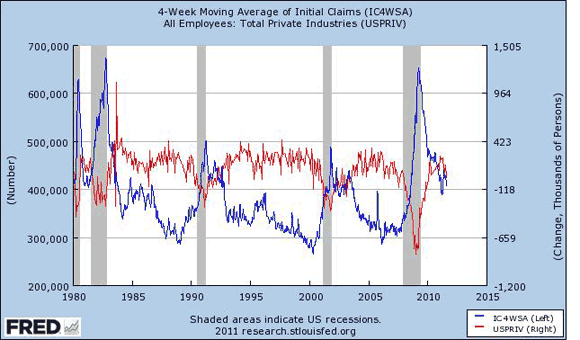
The Importance of 400K
So why is the 400,000 level so significant? The next graph shows why. Historically that has been the inflection point where the economy starts to add a lot of jobs. It layers over the monthly gain or loss in private sector jobs (red line, right hand scale) and total jobs (blue line). Unfortunately, the automatic scaling did not put a line at zero for the job growth line, so you will have to eyeball it a bit.
Notice the strong inverse correlation between job growth and initial claims, and how when the blue initial claims number is below the 400,000 level that job growth is strong. OK, so it’s not that an increase from 399,000 to 400,000 is all that much difference than from 397,000 to 398,000 or from 402,000 to 403,000, but big round numbers are psychologically important, especially when that round number is near a historical inflection point.
Continuing Claims
The data on regular continuing claims was slightly encouraging this week. Regular continuing claims for unemployment insurance fell by 20,000 to 3.729 million. The overall trend is in the right direction. They are down by 733,000 or 16.4% from a year ago.
Regular claims are paid by the state governments, and run out after just 26 weeks. (Several states have lowered the number of weeks they are going to pay in the future recently. They have also been tightening up the eligibility standards.)
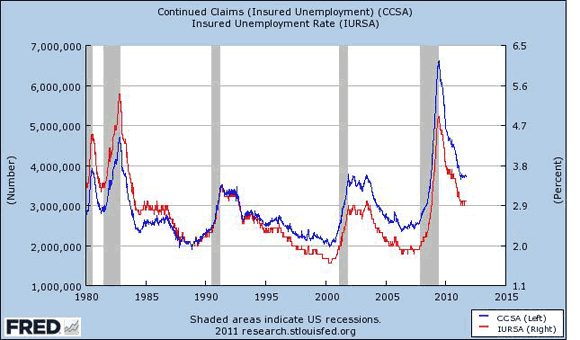
The next graph shows the long-term history of continuing claims for unemployment, as well as the percentage of the covered workforce that is receiving regular state benefits. It does a good job of showing just how nasty that the Great Recession was for the job market. It also shows how things at the regular state unemployment benefit level have been getting much better over the last year (but still well above the peaks of the last two recessions).
Still, we are closing in on being down to half of peak levels. Note that the insured unemployment rate generally follows the direction of the number of claims, but has been gradually diverging over time. That is a function of the overall growth of the labor force, and of tighter eligibility standards for getting unemployment insurance over time. It also reflects the fact that this time around a very large proportion of those getting unemployment benefits are getting them from the extended federal programs, not from the regular state programs.
Long-Term Unemployment
In August, half of all the unemployed had been out of work for 21.8 weeks (down from a record high of 25.5 weeks in June 2010, but up from 21.2 weeks in July), and 42.9% had been out of work for more than 26 weeks. Just for a point of perspective, prior to the Great Recession, the highest the median duration of unemployment had ever reached was 12.3 weeks, near the bottom of the ’82-83 downturn.
Clearly a measure of unemployment that by definition excludes 42.9% of the unemployed paints a very incomplete picture. The number of short-term unemployed (less than 5 weeks) was actually on the low side. The problem in terms of employment is not a lot of firing, but a lack of hiring. This has been the case for some time now.
After the 26 weeks are up, people move over to extended benefits, which are paid for by the federal government. While regular claims are down, it is in large part due to people aging out of the regular benefits and “graduating” to extended benefits. Unfortunately, the data on extended claims in prior recessions is not available at the St. Louis Fed database. However, given the extraordinary duration of unemployment, it is a safe bet that they are higher than in previous downturns.
The extended claims have also been trending down. The ride down has been a bumpy one though. They (the two largest programs combined) rose by 75,000 to 3.581 million this week. That puts them 1.298 million, or 26.6% below the year-ago level of 4.879 million. A much better measure is the total number of people getting benefits, regardless of which level of government pays for them. This is particularly true when looking at the longer term, not the week-to-week changes.
Combined, regular claims and extended claims (including a few much smaller programs) rose by 95,000 to 6.985 million on the week and are down 1.945 million or 21.8% below last year. (The extended claims numbers are not seasonally adjusted, while the initial and continuing claims are, so there is always little bit of apples to oranges. In addition, the continuing claims data are a week behind the initial claims, and extended claims are a week behind the extended claims data.)
People will still “graduate” from the system after 99 weeks, but people will continue to be able to move to the next tier up to the 99-week limit. Extended benefits are in four different tiers, so if benefits had not been extended, some people would have lost their benefits after 39 weeks of being out of work. Unless there is a change (extremely unlikely give the recent congressional budget deal), the extended benefits will end at the end of the year. Somehow I doubt that all of those 3.581 million people will have found jobs by then, as many employers are not even considering hiring people who have been out of work for more than six months, even if they have openings and the person is well qualified.
What we are looking at is a massive increase in poverty coming at us next year. Extending unemployment benefits for another year is a key part of the jobs bill (AJA) that President Obama recently submitted to Congress. However, even if passed, it would not help those who have gone beyond the 99-week threshold.
Improvements, but Still Way Down
While the employment picture has improved from a year ago, in any absolute sense it is still just plain awful. State-level spending cuts have been intense in 2011 and are expected to be even more so in 2012. The Federal Reserve, which was doing its part by keeping rates low and by using quantitative easing, now seems to be on the sidelines again. Operation Twist, announced last week, may be effective in bringing down longer-term interest rates (it sure had that effect right after it was announced) but how much that drop in longer-term rates will help is an open question. Rates were already at historic lows.
It, like the rest of Washington, is deeply divided. $400 billion worth of rearranging the deck chairs is not going to have all that much of an effect on the real economy. While monetary stimulus helps a little bit, it is much less effective than fiscal stimulus would be. Right now, monetary policy is sort of “pushing on a string.”
QE2 is over with. Operation Twist does not expand the Fed balance sheet, and thus does not really add that much to the economy. The most recently released Fed minutes revealed that the Fed is deeply divided on what to do about the situation. The “promise” that the Fed made to keep the Fed Funds rate at the current 0-0.25% range until the middle of 2013 is causing the private sector to do a bit of quantitative easing on its own.
One of the principal aims of QE is to lower mid- to long-term interest rates, and they sure have come down a lot of late. However, the problem the economy has is not that the cost of capital is too high. Interest rates along the entire curve are at historic lows.
The problem is a lack of demand stemming from the decimation of household balance sheets in the popping of the housing bubble. If people can re-fi their mortgages, that would add some more spending power to the economy, but the people who need to refi the most, those who are underwater on their mortgages, can’t, regardless of how low mortgage rates go.
The Fed Still Pays Banks for Excess Reserves
One thing the Fed could do is end the policy of paying banks 0.25% on their excess reserves. Ending that policy is long overdue, particularly when 0.25% is more than the rate on the two-year T-note. In effect, the Fed is paying banks not to lend. That might be a useful thing to do if the Fed were trying to drain the money supply and slow down an overheated economy, but it seems counter to their basic objectives at this time. Unfortunately, the Fed did not take that step. It would not be a magic bullet, but it would be helpful on the margin.
Additional Fed action it is not totally out of the question, and the recent data has to be pushing the Fed in the direction of doing something more. However, there were three dissenters in the last two policy statements, who objected to even the very mild step of making the “extended period” language more explicit to mean until mid-2013, and to doing Operation Twist. They want the Fed to have the flexibility to raise rates much sooner than that.
Personally, I think the dissenters are nuts. Operation Twist would not have been my first choice, but at the margin it is a very small step in the right direction.
Reason for Hope?
The four-week average staying above the 400,000 level is a discouraging, but not unexpected, sign. However, if this week’s level is maintained, in just a few weeks it too will be below the 400,000 level. In the last two recoveries, when it got below that threshold, that job creation really started to take off.
Declining continuing and extended claims numbers are a good thing, but only if people are leaving the rolls for the “right” reason. If they are leaving for the “wrong” reason, because the benefits have simply run out, the declines are not really good news (even if they do help reduce government spending), they are just a reflection of millions of people slipping into poverty. Hardly a thing to celebrate.
Disclaimer: This page contains affiliate links. If you choose to make a purchase after clicking a link, we may receive a commission at no additional cost to you. Thank you for your support!

Leave a Reply