Call it choppy, volatile, fickle or lively, market action continued to disappoint this week. Frightened investors pulled out more than $40 billion from long-term mutual funds for the week ended August 10, according to the Investment Company Institute.
The eurozone crisis fueled the outflows as economic growth figures for several eurozone countries disappointed—a hard trend to break given the austerity measures being implemented. Relatively, U.S. stocks have only suffered a fraction of the pain (down roughly 5 percent year-to-date as of August 16) felt by investors in the U.K. (down 9.2 percent), Germany (down 13.2 percent), France (down 15.1 percent) and Italy (21.9 percent).
Given this landscape, the International Strategy and Investment Group (ISI) lowered its forecast for global growth to 2.5 percent in 2012. That’s down from the 4-5 percent growth level many were estimating.
There is a silver lining: Despite all the negative news out there, the global economy will continue to grow.
In fact, the U.S. economy has had several positive developments recently. The four-week average for unemployment claims dropped to 402,000 during the week ending August 13. There is still a large chunk of America unable to find a job, but that group has shrunk 13 percent since August 2010 and is about 40 percent of peak 2009 levels.
Many S&P 500 companies have leveraged strong economic growth in emerging markets and a weaker U.S. dollar into higher profits. Second-quarter 2011 earnings for companies in the S&P 500 Index have been superb with nearly 71 percent of company earnings beating expectations, per ISI.
According to Citigroup, this continues a trend established in 2010 when year-over-year earnings for the S&P 500 were up more than 38 percent, more than double the historical average during the first full year following a recession.
In addition, the strong earnings report is across all sectors. These companies are also sitting on nearly the largest cash cushions as a percent of market capitalization (about 11 percent) we’ve seen in 20 years, Citigroup says. Markets have historically bottomed when cash as a percentage of market cap reaches 9 percent.
We’ve also seen a surge in U.S. money supply (M2). ISI says M2 has surged $460 billion (about 5 percent—38 percent on an annualized rate) over the past eight weeks. Though the rise is largely due to a plunge in institutional money funds, increased money supply means more funds are available to be lent out, pushing down borrowing rates. Access to this “cheap capital” can increase confidence and entice businesses to put cash to work.
Around the globe, two recent bright spots have been Taiwan and Russia. Taiwan’s equity market is technology heavy, says BCA Research, and the market’s performance tends to track the global information technology sector, not global markets. BCA says that Taiwan is set to outperform because “after two decades of stagnation, domestic demand has been showing signs of reviving…[and] equity/currency valuations remain attractive.” In Russia, strong cash positions and subdued credit flows since 2008 mean Russia’s “equity and credit markets are likely to outperform in the months ahead,” BCA says.
Those investors who have been waiting for a bounce in the markets may not have to wait too long. We mentioned last week that the S&P 500 has historically experienced strong upward moves after the CBOE Volatility Index (VIX) reaches extreme levels. Research from Citigroup backs up this assertion, showing the average return for the S&P 500 is 5.5 percent (three months), 9.4 percent (six months) and 18.9 percent (12 months) following a breach of the 35-40 on the VIX.
The Neverending Story of a “Gold Bubble”
Gold continued to make headlines this week, reaching nearly $1,900 an ounce on Friday before resting around the $1,850 level. Gold’s 15 percent rise to new nominal highs over the past month has rekindled “gold bubble” talk from many pundits. Long-term gold bulls have been forced to listen to these naysayers since gold reached $500 an ounce. If you would have joined their groupthink then, you would’ve missed gold’s roughly 270 percent rise since.
That said, gold is due for a correction. It would be a non-event to see a 10 percent drop in gold. This would actually be a healthy development for markets by shaking out the short-term speculators while the long-term story remains on solid ground.
Forty years ago this week, President Richard Nixon “closed the gold window,” ending the gold-backed global monetary system established at the Bretton Woods Conference in 1944 and kicking off a decade of stagflation for the U.S. economy.
At the time, $1 would buy 1/35th an ounce of gold. Today, $1 will net you about 1/1,178th an ounce of gold. Put differently, “One U.S. dollar now buys only 2 cents worth of the gold it could buy in 1971,” says Gold Stock Analyst. This means that consumers have lost roughly 98 percent of their purchasing power compared to gold over the past 40 years.
The U.S. dollar isn’t the only asset gold has outperformed during recent decades. The yellow metal has also seen periods of relative strength against the S&P 500. This chart from Gold Stock Analyst pits the performance of gold bullion against the S&P 500 since 1971—you can see that gold immediately rallied following Nixon’s announcement before peaking at $850 an ounce in 1980. At that price, one ounce of gold was 7.6 times greater than the S&P 500, according to Gold Stock Analyst. Gold’s relative performance then declined for the next 20 years, with the S&P 500 taking the lead in 1992 and peaking at 5.3 times the value of gold in 1999. Currently, gold’s value is roughly 1.6 times greater than the S&P 500.
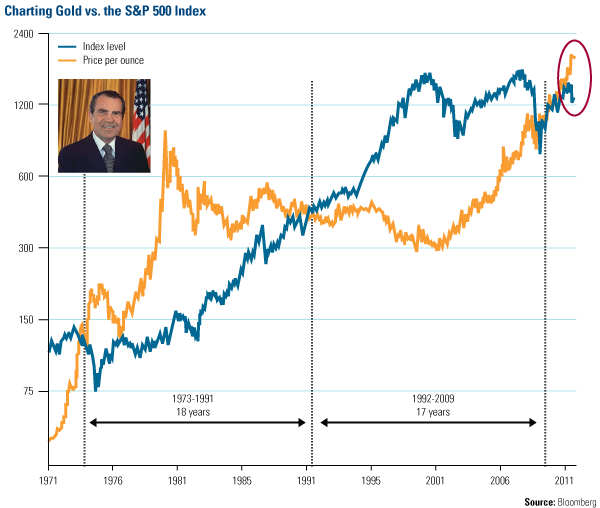
What drove gold’s relative underperformance from 1980 to 1999? It was a shift in government policies, which have historically been precursors to change—a key tenant of our investment process here at U.S. Global Investors.
Gold Stock Analyst points out that Federal Reserve Chairman Paul Volcker began steering the U.S. economy toward positive real interest rates in 1980 and Volcker’s goal was met in 1992—the same year the S&P 500 overtook gold.
In order for gold’s relative value to return to 1979-1980 peak levels of 7.6 times the S&P 500, Gold Stock Analyst’s John Doody says gold prices would have to hit the $10,000 mark. Obviously that scenario is unlikely, but it does put all this “gold bubble” nonsense into perspective.
One point to pop the “gold bubble” talk is that negative real interest rates are poised to stick around for a while. We’ve previously discussed that negative real interest rates—one of the main drivers of the Fear Trade—have historically been a miracle elixir for higher gold prices. The magic number for real interest rates is 2 percent. That’s when you can earn more than 2 percent on a U.S. Treasury bill after discounting for inflation. Our research has shown that commodities tend to perform well when rates fall below 2 percent.
Take gold and silver, for example, which have historically appreciated when the real interest rate dips below 2 percent. Additionally, the lower real interest rates drop, the stronger the returns tend to be for gold. On the other hand, once real interest rates rise above the 2 percent mark, you start to see negative year-over-year returns for both gold and silver.
It’s important to point out that it’s the political policies not political parties that drive this phenomenon. During the 1990s, when President Clinton was in office, there was a budget surplus and investors could earn more on Treasury bills (about 3 percent) than the inflationary rate (about 2). This gave investors little incentive to embrace commodities such as gold, and prices hovered around $250 an ounce.
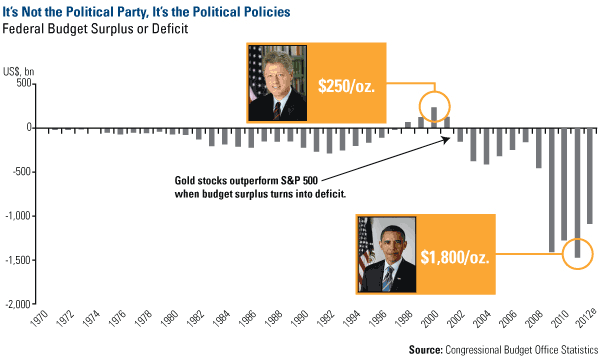
Since 2001, increased regulation in all aspects of life, negative real interest rates, welfare and entitlement expansion funded with increased deficit spending have created an imbalance in America’s economic system. It’s this disequilibrium between fiscal and monetary policies that drives gold to outperform in a country’s currency. Today, the Fed capped interest rates near zero back in 2008 and the federal budget deficit has ballooned to $1.4 trillion. In fact, both the deficit as a percentage of GDP (negative 11 percent) and federal government debt as a percentage of GDP (nearly 65 percent) are at the highest levels since 1950, Citigroup research shows. This has helped fuel gold’s rise through $1,000, $1,500 and now $1,800 an ounce.
This is only one side of gold’s long-term story. Another point to pop the “gold bubble” talk is that we’re entering what has historically been gold’s strongest period of the year in terms of demand. In the past, gold prices have bottomed in August but recently gold’s strong seasonal period has extended into the dog days of summer as the holy Muslim holiday of Ramadan moves forward on the calendar by 10 days each year. This year Ramadan began August 1.
In its latest Gold Demand Trends report, the World Gold Council (WGC) confirmed that the Love Trade is burning bright in Asia. The WGC council said Chinese and Indian buyers continue to be the “predominant drivers” of gold demand, accounting for “52 percent of bars and coins and 55 percent of jewelry demand.” China’s demand grew 25 percent, while India saw an increase of 38 percent. WGC attributes this growth to “increasing levels of economic prosperity, high levels of inflation and forthcoming key gold purchasing festivals.”
But China and India aren’t the only emerging markets feeling the love for gold. Vietnam, Indonesia, South Korea and Thailand – labeled by the WGC as the “VIST” countries – are additional key gold-consuming countries.
The WGC’s chart below shows a potential opportunity in increased demand for gold, especially in jewelry, in the VIST countries. In 2010, demand rose to 253 tons after a sharp drop in 2009. Jewelry demand, however, was historically low while investment demand grew considerably.
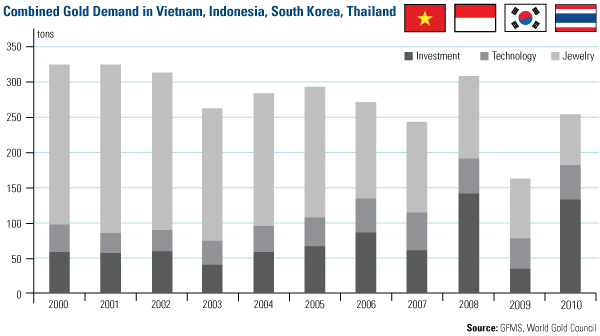
Similar to China and India, the VIST countries have had a 2,000-year long relationship with gold which is intertwined in their culture, religion and economy. Jewelry and investment demand are one and the same, says the WGC: “The demand for gold as a store or accumulator of wealth, as an auspicious gift or as insurance against unforeseen risks, is to a large extent independent of the form it takes.”
This strong tie to gold means that, as wealth among residents of Vietnam, Indonesia, South Korea and Thailand increases, price is less of a consideration, and gold will continue to be at the top of their shopping lists.
At some point in the future gold prices will fall, that’s for certain. However, don’t expect it to happen soon. We believe the one-two punch of the Fear Trade and Love Trade will keep gold prices at elevated levels for another few years.
Disclaimer: This page contains affiliate links. If you choose to make a purchase after clicking a link, we may receive a commission at no additional cost to you. Thank you for your support!


Leave a Reply