Today is largely about option expiries, so we thought we’d take the opportunity to sit on our hands and, instead, have a look at the “Big Picture”.
TMM reckon that the current state of the World can be described as follows:
- The US: The slowdown is dramatic (more on this below) but positive actual GDP prints, a Pavlovian dog-like response in the form of dip-buying on weakness (learned over the past two years), and a belief in the Fed coming to the rescue have prevented both the PhD and punting community from embracing a negative view.
- Europe: Smoke is coming out of the tail pipe, kangaroo-ing down the the road. Going to break down soon.
- China: “DON’T TALK ABOUT ANYTHING NEGATIVE!” as China is the only hope the West has. It seems to TMM as though punters are looking through to the peak in inflation and holding onto the soft-landing view – something they sense from the fact that most commentaries on China they receive seem to talk about how too many people are fearful of a hard landing/inflation etc… where is the *real* consensus?
This morning’s rumours around a further EUR 150bn package for Greece have TMM shaking their heads at the Eurostriches, as it is no longer about the amounts, so much as the conditionality. The PASOK cabinet reshuffle appears to be something of a wash, and we look to next week’s confidence vote for direction, but it doesn’t really seem as though either side are backing down from conditionality. TMM trust in the A-Team’s ability to screw it up. But given the moves in the credit market this week, it’s hard to get overally bearish on the Euro or spreads here without an imminent credit event, especially in the context of EUR trading around it’s 100day moving average.
But what TMM find particularly interesting is that many players still seem to view the recent risk aversion as a function of Greek developments. But hiding behind this facia, is the dramatic slowing in global data and, in particular, that of the US. Many have tried to argue that this is simply the result of supply chain-related shock-waves from the Fukashima earthquake, but it is becoming increasingly difficult to justify this view in the face of the recent Empire & Philly Fed surveys, not to mention the jobs data more broadly. Indeed, all TMM seem to see in terms of commentary on the disappointing data is that surely the data can’t continue to surprise to the downside indefinitely. That, of course, is a mathematical certainty. But TMM, reluctantly, must quote their arch-nemesis Merv the Swerve: “It’s the levels, stupid”. Many assets are only correctly priced if the data rebounds, not if expectations are lowered. TMM do not believe markets (or the PhD community) have even come close to capitulating on their growth views in the way they did last summer.
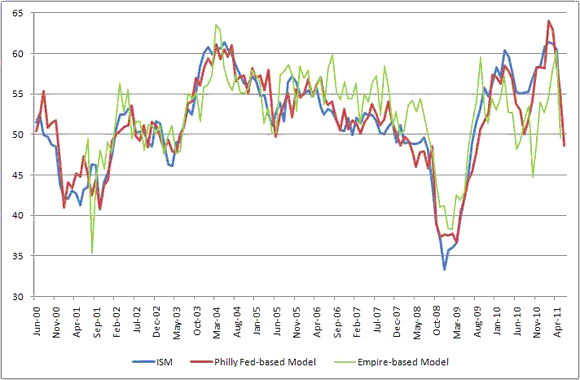
This is striking, because this year’s slowdown is far more material than last year’s. Indeed, TMM’s models of ISM (see chart below, blue line) based upon the Philly Fed (red line) and the Empire State (green line) surveys are consistent with ISM falling to around 49. Admittedely, these (in particular, the Empire survey) overstated the weakness in ISM in 2010 but, particularly in the case of the Philly Fed, have provided a much closer fit since. TMM have barely heard a peep about a “double dip” or indeed, the “R” word. Should ISM print close to this level, we reckon that such talk (and associated market moves) would have to become more widespread.
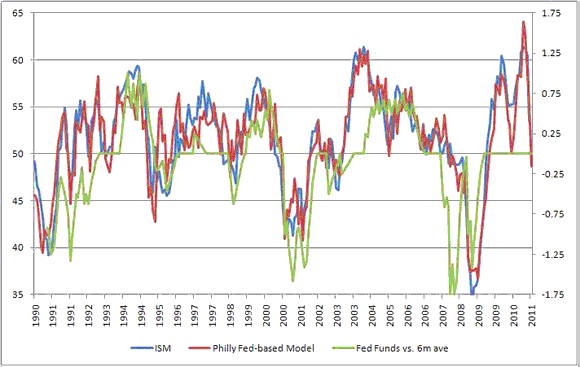
And this is where TMM reckon there is extreme complacency. There has been a bit of chatter about the potential for QE3, but it is clear from the political backlash – both domestically and internationally – to QE2 that the bar for further balance sheet expansion is significantly higher than it was last year. Perhaps we would need to see a sharp increase in the unemployment rate or, more worryingly, a negative payroll print. In this context, TMM believe that policy is *already* too tight and that the Fed needs to ease. The below chart shows a longer history of ISM & TMM’s Philly-Fed based ISM model vs. difference between Fed Funds and it’s 6month rolling average (in order to show when policy was being tightened or eased). The Fed have eased policy when these measures fell to 50 on all but one occasion. And TMM would suggest the exception (where the model touched 50, but ISM held above in this case, during the GM/Ford-driven CDS auto-correlation scare in the spring of 2005) is probably just statistical noise as a result of their model being somewhat basic. It is notable that when we reached similar levels last summer, the Fed moved to an easing stance.
So, to sum up, TMM reckon that the Fed will eventually be forced to ease, but the higher bar conflicting with the demonstrable view that policy is already tight mean that the curve needs to continue to flatten. Which is also in conflict with many punters’ continual efforts to sell Treasuries. That said, with many assets trading close to technically important levels (the Euro and Spooz, in particular), TMM find it hard to express much conviction here, and wait for either an opportunity to sell a rally in risk assets or sell a break.
Disclaimer: This page contains affiliate links. If you choose to make a purchase after clicking a link, we may receive a commission at no additional cost to you. Thank you for your support!


Leave a Reply