Mark Dow of Pharo Management today posted an interesting vehicle sales chart that shows two time series: the red line is Brazilian vehicle sales going back to 2001 ; the white line is the vehicle sales in the US. The two time series are normalized to Dec 2001, illustrating the apparent contrast in growth rates. As Dow notes, “it paints a powerful picture.”
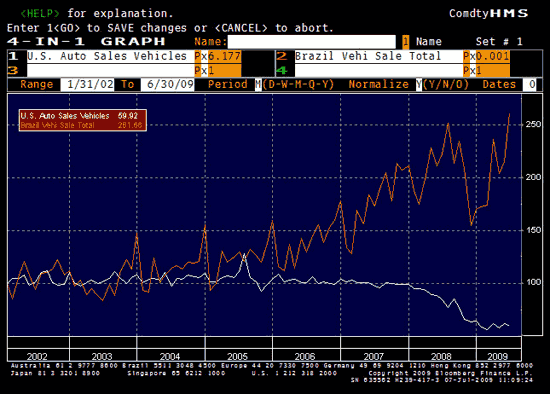
Vehicle sales depend on demographic and economic factors, and of course on the cyclical pattern. But judging from this chart, I’d say it looks more like decoupling.
Graph: CFR
Disclaimer: This page contains affiliate links. If you choose to make a purchase after clicking a link, we may receive a commission at no additional cost to you. Thank you for your support!
Leave a Reply