New Home Sales in April rose by 7.3% from April, to a rate of 323,000. Relative to a year ago, sales are down 23.1%. While the rebound is more than welcome, it is still a very dismal rate of New Home sales.
In additional good news about the direction of new home sales, the March sales levels were revised up to an annual rate of 301,000 from 300,000. Thus, relative to where we thought we were, it could be seen as a 7.7% increase.
The April level was substantially better than the expected rate of 300,000. Still, the 12 lowest months on record (back to 1963) for new home sales have all been in the last year. We are down sharply from a year ago, but that was against a “tough” comp, as sales were inflated by the rush to get in under the wire and collect the homebuyer tax credit. Sales collapsed after that, so the May comp should be an easy one.
Relative to the peak of the housing bubble (July 2005, 1.389 million) new home sales are down 76.7%. The graph below shows the history of new homes sales (blue, left scale) along with the growth in population (red, right scale), since presumably if you have more people, you will need more places for them to live.
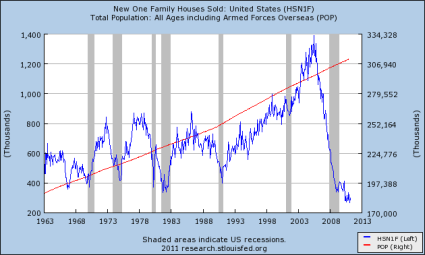
Take a very close look at the relationship between new home sales and the grey recession bars. New home sales fall sharply before all recessions (with the exception of the dot.com bust caused recession of 2001) and then start to increase sharply in the middle of, or towards the end of the recession. That clearly is not happening this time around.
If you want to know why the recovery has been anemic so far, look no further than the graph above! New home sales are vital to the overall economy. If new homes are not selling, then home builders have no reason to build more of them. After all, that is very expensive inventory to sit on.
New Homes & Economic Activity
Unlike used home sales, each new home built creates a huge amount of economic activity. Not only are low new home sales bad for the big homebuilders like D.R. Horton (DHI), but also for all the companies that make the products and supplies that go into making a new house. They range from Berkshire Hathaway (BRK.B) for bricks, roofing materials and insulation to Fortune Brands (FO) for plumbing fixtures and cabinets to USG (USG) for wallboard to PPG Industries (PPG) for glass and paint to International Paper (IP) for lumber.
In terms of employment, it is not just all the roofers and framers that lose jobs due to weak new home sales, but employees at all the firms that make the stuff that goes into making a new home. Of course, if those employees are out of work, they are not spending on other goods and services, dragging down a host of seemingly unrelated businesses.
Not that the direct impact of construction jobs should be underestimated. Since the recession started, one out of every four jobs lost has come from the construction industry.
Inventory Levels
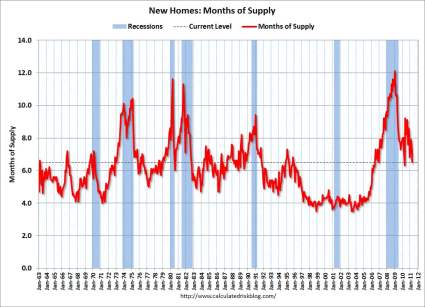
Inventories of new homes were down 2.8% on the month and are down 19.4% from a year ago. The months of supply is at 6.5 months, down from 7.2 months in February, but up from 6.2 months a year ago. That is well off the peak of 12.0 months, and is now just slightly above normal.
A healthy market has about a six month supply of new houses, and during the bubble four months was the norm, as is shown in the graph below (from http://www.calculatedriskblog.com/). Of course, used homes are very good substitutes for new homes, and last week we found out that the months of supply for used homes was 9.2 months, up from 8.3 months in March (see “Used Home Sales Down, Inventories Up“). That suggests downward pressure on existing home prices (and more foreclosure problems), which will continue to make life tough for the housing industry.
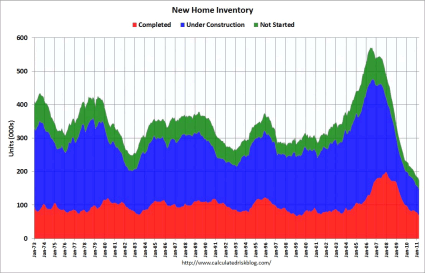
The absolute level of new home inventories is near a record low; the relatively high months supply is entirely due to the low sales rate. Inventories of new homes have now fallen for (at least) 28 straight months. Eventually population growth and a higher rate (more normal) of household formation will absorb the excess inventory.
Given the extremely low levels of new home starts, one does not have to imagine very high absolute levels to generate some very fancy looking percentage increases. The third graph, also from http://www.calculatedriskblog.com), tracks the history of New Home Inventories. Note that inventories have declined at all three levels, not started, is basically improved lots.
The biggest decline has come in homes under construction. The decline in the absolute level of inventories is good news, but is swamped by the still very high level of inventories of used homes.
Results by Region
All four regions saw improvements on a month-to-month basis, and declines on a year-over-year basis. In the West, new home sales rose 15.1% from March but are down 20.8% year over year. The Northeast, the smallest of the four regions, saw a 7.7% increase for the month, but is off 21.8% from a year ago. The Midwest saw a 4.9% increase for the month and a 21.8% year over year decline. The South, by far the largest and thus most important of the four regions, posted a 4.3% increase for the month and a 24.7% year over year decline.
An Improvement, But a Long Way to Go
While this report was better than expected, and we also enjoyed a slight upward revision to last month, it was still an ugly report. The absolute level continues to be dismal.
However, the price indicators were positive. While the median price of a new home rose 1.6% on the month, the average price rose 7.6%. Relative to a year ago, the median (always lower than the average) is up 4.6% to $217,900, while the average price is down 0.6% to $268.900. That is the first positive news on the home pricing front we have seen in many a moon.
However, it probably represents a mix in the location of the houses being sold. Housing prices tend to be much higher in the West and Northeast than they are in the Midwest and the South, and the gains this month were bigger in the higher-cost regions.
With the prices of used houses falling again, it makes selling a new home that much tougher. After all, a used home is a very good substitute for a new home.
The housing sector has been a major drag on the economy for several years now. As Residential Investment is now a very small part of the overall economy (and new home construction is the largest part of, but not all of it), further drops in new home construction will not hurt the economy much going forward, but it sure would be nice to see it on the positive side of the ledger. That will happen eventually, and perhaps this is an early sign of it starting.
New home sales averaging 294,000 in the first quarter, so if the April pace can be maintained, the second quarter would be 9.9% above the first quarter average. Granted, very low absolute numbers make any given percentage gain easier.
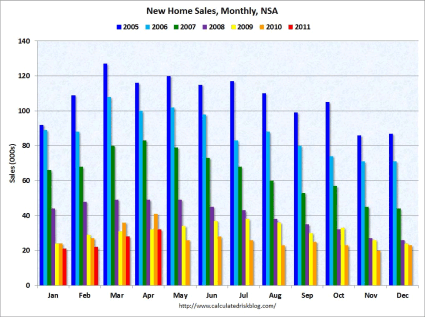
Historically, on a non-seasonally adjusted basis, April is a somewhat weaker month than March for New Home Sales. The increase on a non-seasonally adjusted basis is a good sign. The history of raw, unadjusted sales is shown in the next graph (also from http://www.calculatedriskblog.com).
Unadjusted sales were also higher in April of 2010 than in March, but that was do to the tax credit effect, which is not in place this year. While the raw monthly increase of 14.3% is encouraging, this still matches the record low for April (1982 and 2009).
Household Formation
The main problem right now for housing demand is the very low rate of household formation. Instead of moving out to get their own place, people in their 20’s are being forced to live with Mom and Dad, since they don’t have a job that will pay the rent or support a mortgage.
Since residential investment is such an important swing factor in creating jobs in the country (both directly and indirectly) that sets up a huge “chicken and the egg” problem. We are not in a robust recovery yet, but the seeds have been planted. It is unlikely that they will germinate this spring, but eventually they will sprout.
Recently job creation has picked up a bit, particularly in the private sector, and we have seen some of the excess housing units being absorbed and the vacancy rate start to fall. However, this has mostly been in the rental apartment market. That is a hopeful sign that very low levels of additions to the housing stock (both rental apartment units and single family homes) are starting to have an effect.
The lack of a housing recovery is the key difference between this recovery and every other one which has preceded it. The collapse of the housing sector is directly responsible for a quarter of the jobs lost, and indirectly responsible for many more than that. The loss of jobs has in turn depressed household formation, and thus further depressed the housing market. Even extremely low mortgage rates have not been enough to get things going again.
We still have extremely high vacancy rates, both of apartments and of houses sitting empty, although lately we have seen some improvement in the rental market. Until that excess is absorbed, it is unlikely that we will get anything like a robust housing sector, although, even a tripling of the new home sales rate from current levels would bring us to what was considered a normal rate of sales back in the 1970’s and 1980’s. Back then we had far fewer people, and thus a lower need for places for people to live. Like a kidney stone, this too shall pass.
Ultimately a Positive Report
Overall, I would have to count this report though as a positive, as it was better than expected and we had a nice decline in the months of supply. The absolute decline in the level of inventory has been impressive. I’m not going to get giddy anytime soon, though. We might be starting down the path towards a recovery in the housing sector, but it is likely to be a long and difficult road before we reach our destination.
Disclaimer: This page contains affiliate links. If you choose to make a purchase after clicking a link, we may receive a commission at no additional cost to you. Thank you for your support!


Leave a Reply