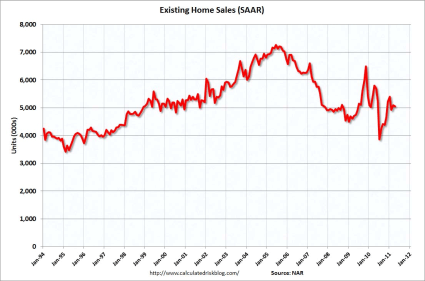
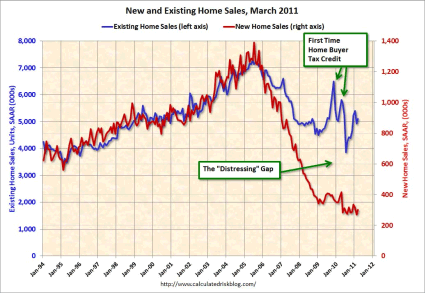
In April, Existing Home Sales ran at a seasonally adjusted annual rate of 5.05 million. That pace is 0.8% lower than in March, and 12.9% below the year-ago rate. The year-ago numbers were somewhat inflated due to the end of the homebuyer tax credit.
The April sales rate was below consensus expectations of a 5.23 million annual rate. March was revised down from an initial read of 5.10 million, to 5.09 million. The history of used home sales is shown in the graph below, (from http://www.calculatedriskblog.com)
By Type of Home
Sales of single family homes fell by 0.5% on the month to a rate of 4.42 million, and are off 12.6% year over year. The median price of a single family home nationwide slipped 5.4% from a year ago to $163,200.
Condo and co-op sales fell 3.1% on the month, and are down 15.0% year over year. The median Condo price fell 2.3% from a year ago to $167.3.
For all existing homes, the median price was down 5.0% to $163,700. Some of the weakness in median price from a year ago is due to an increase in distressed sales (mostly former foreclosures and short sales). They fell to 37% of the total in April from 40% in March, but up from 33% a year ago.
Despite mortgage rates staying very low — averaging 4.84% in April — unchanged from March and down from 5.10% a year ago, the proportion of people buying homes for cash has been increasing. In April, 31% of all buyers simply wrote a check, rather than getting a mortgage, down from a record 35% in March, but up from 26% a year ago.
By Region
Regionally sales were down on the month in three of the four census regions. The Midwest was the exception, with a 5.7% rise for the month but a 16.4% decline from a year ago. The Northeast had the biggest month-to-month decrease, with sales falling 7.5% and 32.1% from a year ago. In the West, sales fell 1.6% for the month and are down 0.8% year over year. The South, the largest of the four regions, saw a 1.0% decline on the month, and a 9.3% year over year decline.
We saw lower median prices in all four regions. Those ranged from a 4.1% decline in the South to a 7.3% plunge in the Northeast relative to a year ago. While the median price is not the best measure of housing prices over time (changes in the mix of houses being sold can be a significant influence), the price declines are in line with (OK, a bit worse, but consistent with) the data we have seen from better home price series like the Case Schiller index.
The level of activity in used home sales really is not that important in isolation. It is just the transfer of an existing asset, and does not add a lot to economic growth. The one exception to that is Realtor’s commissions. Indirectly, it can help as people will often remodel and redecorate a “new for them” house. That can stimulate some sales for paint companies like Sherwin Williams (SHW) and perhaps it is good for furniture firms like La-Z-Boy (LZB), but it pales compared to the economic activity generated by a new home sale.
New homes not only need new paint on the walls, but they need the walls. That means lots of business for wallboard firms like USG (USG), timber firms like Weyerhaeuser (WY) and roofing and insulation firms like the Johns Manville division of Berkshire Hathaway (BRK.B). It also means that those firms have to hire more workers, so the employment effect of new home sales goes well beyond the roofers and carpenters actually on the jobsite.
Inventory & Housing Prices
Where used home sales are important is in relation to the inventory of houses for sale. That will influence the future direction of hosing prices. Used home prices are extremely important. As used home prices fall, more and more people find themselves underwater on their mortgages. As long as a homeowner has positive equity in their house, the foreclosure rate should be zero. After all, it is better to simply sell the house and get something for it, rather than simply let the bank take it and get nothing for it.
The more people underwater, and the deeper they are, the higher foreclosures and strategic defaults are going to be. A strategic default is when someone has the cash flow available to continue to make his mortgage payment, but simply decides not to, since paying is a just plain stupid thing to do from a financial perspective.
If you have a house that could only sell for $150,000 n the current environment, and you owe $200,000 on the mortgage, in effect you have the option of “selling” the house to the bank for $200,000 simply by stopping writing the checks. Of course, that will be a hit to your credit rating, but $50,000 is probably worth a bit of a tarnish on your Fico score. If the difference is only $5000, then the hit to your credit score makes less sense, and there are lots of non-economic factors (a house is, after all, a home — not just an investment) that come into play.
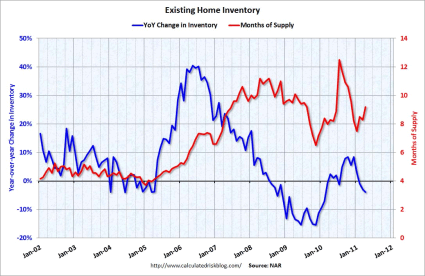
In March, inventories rose by 9.9% to 3.87 million. That puts the months of supply at 9.2 months, up from 8.3 months in March, and as high as 12.5 months in June. While not as bad as last June, it is still a very high level. A “normal” months of supply is about six months, and during the housing bubble four months was the norm. Also, the inventory numbers are not seasonally adjusted, even thought here is a seasonal pattern when they tend to decline in the winter (especially around the holidays) and then increase in the spring.
The second graph (also from http://www.calculatedriskblog.com) traces the months of supply and the year over year change in inventory. The level still suggests downward pressure on existing home prices over the next few months. The inventory numbers (and hence the months supply) are not seasonally adjusted, and there is a tendency for inventory levels to rise in the spring. The year-over-year drop in inventory is somewhat encouraging, but the level of inventories has to be viewed relative to the sales pace.
The Future of Housing Prices
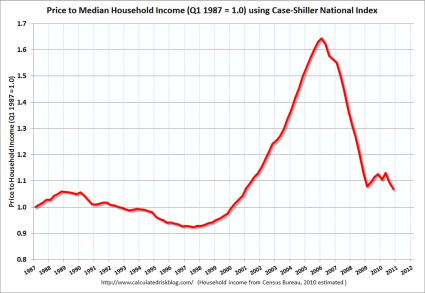
Fortunately, relative to incomes and rents, home prices are not as absurdly overvalued as they were then, so the magnitude of the coming price declines is likely to be a lot less over the next year than the 30% plunge in 2008 and early 2009. I suspect they will fall by about 5% from here, and will probably bottom out by the end of the year.
Still, that could do a lot of damage, since the equity cushions are a lot smaller now than they were in 2007 or early 2008. If housing prices fall more than 5%, then lots of people with razor-thin current positive equity will also be underwater, and lots of homes that are only slightly underwater (where non-financial considerations tend to dominate) will become deeply underwater.
There are some very well respected housing economists, including Robert Schiller (creator of the Case Schiller index), who are far more pessimistic than I about the future of housing prices, thinking prices could drop 20% or more from current levels. While that is possible, especially if the current unrest in the Middle East results in a prolonged period of higher energy prices that substantially slows the overall economy, I do not see that as the most likely case.
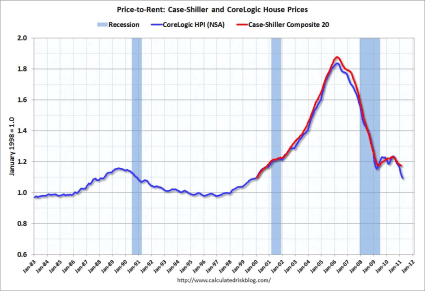
The next two graphs (also from http://www.calculatedriskblog.com) track housing prices relative to the two most important drivers of housing prices, rents and incomes. My forecast of a further 5% decline would put prices roughly in the middle of the range where they were in the 1990’s. Dr. Schiller’s would put housing prices at the very low end of that range. I would say the risk is more that Dr. Schiller has it right, rather than we are both wrong (and him very wrong) and housing prices start to rebound in the near term.
Foreclosures to Pick Up?
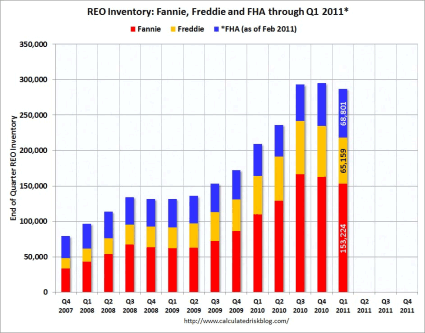
However, with falling home prices, it is likely that the pace of foreclosures will pick up again. Even with the slowdown in foreclosures, the number of homes that are now owned by Fannie, Freddie and the FHA is mounting as can be seen in the next graph (again from http://www.calculatedriskblog.com). Those institutions have no use for those homes and they will go on the market, often at very aggressive prices, putting downward pressure on the market.
Most of those who are being foreclosed on have indeed fallen far behind in their mortgage payments, and so in that sense the foreclosures are legitimate, even if the paperwork is a mess. The combination of underwater homes and reduced cash flow from one or both of the breadwinners in a family being out of work is a toxic mixture for the health of not just the housing market, but the economy as a whole.
Weak Report, Below Expectations
While it is normal for inventory to rise in the spring, a 9.9% increase is much more than normal. The huge glut of existing homes on the market, and the shadow inventory of homes that is likely to be foreclosed upon and thus come to market in the near future, means that we really have very little need to build new homes.
Thus residential investment — the historical prime locomotive in pulling the economy out of recessions — will stay derailed. We saw that in the 10.6% monthly, and 23.9% year-over-year decline in housing starts that was released on Tuesday. The jobs not created by a rebound in housing construction will mean that household formation will stay depressed, thus further depressing the demand for housing.
To put that in more concrete terms, young adults will not be able to get a job and form a family; instead, they will continue living in Mom and Dad’s basement, rather than soak up the existing housing inventory. A nasty “chicken and the egg” situation.
The most important part of this report is what it says about the future direction of home prices. There the news is still bad, and at the margin, getting worse. In terms of economic activity and growth, the far more important report, New Home Sales, comes out next week.
New Home Sales have been slammed much harder than existing home sales. In normal times, there is about a 6:1 ratio between existing and new home sales. In March, that ratio was 17:1. I would expect a small increase in New Home Sales, but they will be coming off a record low.
I suspect it will be a long time (perhaps until 2015 or so) before we return to that historic 6:1 ratio. Still, that would imply an annual rate of new home sales of 916,000 based on the current level used home sales, or more than triple the March level, even over a four-year recovery period, that still works out to a very strong compounded annual growth rate of 45.1%. That will be an important factor in overall economic growth going forward.
Sherwin Williams (SHW): Free Stock Analysis Report
Disclaimer: This page contains affiliate links. If you choose to make a purchase after clicking a link, we may receive a commission at no additional cost to you. Thank you for your support!


Leave a Reply