Ryan King writes:
This involves causal inference, hierarchical setup, small effect sizes (in absolute terms), and will doubtless be heavily reported in the media.
The article is by Manudeep Bhuller, Tarjei Havnes, Edwin Leuven, and Magne Mogstad and begins as follows:
Does internet use trigger sex crime? We use unique Norwegian data on crime and internet adoption to shed light on this question. A public program with limited funding rolled out broadband access points in 2000-2008, and provides plausibly exogenous variation in internet use. Our instrumental variables and fixed effect estimates show that internet use is associated with a substantial increase in reported incidences of rape and other sex crimes. We present a theoretical framework that highlights three mechanisms for how internet use may affect reported sex crime, namely a reporting effect, a matching effect on potential offenders and victims, and a direct effect on crime propensity. Our results indicate that the direct effect is non-negligible and positive, plausibly as a result of increased consumption of pornography.
How big is the effect?
A 1 percentage point increase in internet use is associated with an increase in rapes of 0.14 and an increase in child sex abuse of 0.16, per 100,000 inhabitants. The effects on the overall sex crime rate and rapes are precisely estimated, being statistically significant at the 5%-level.
How much is this? A 1% change in internet use seems uninteresting. Perhaps we should multiply by 50? A 50% increase in internet use (which is roughly what was observed in Norway, accorind to one of the graphs) is associated in their fitted model with an increase in rapes of 7 per 100,000 and in increase in child sex abuse of 8 per 100,000.
How big are these numbers? According to Figure 4, the overall rate of rape is about 15 per 100,000 and the overall rate of child sex abuse is about 25 per 100,000. So, unless I’m missing something here, the estimate is that about half the rapes and one-third of the child sex abuse are caused by the internet.
(Figures 2-4 confused me at first because the time axes are on different scales.)
I don’t have it in me to try to evaluate this paper in detail. But what I really want to see here is a scatterplot. I want to see what the data say: where is the leverage coming from? Presumably the sex crimes rates are increasing faster in certain cities than others, coinciding to some extent with internet coverage. I’d just like to see the basic pattern to understand where the conclusions are coming from. A scatterplot is not the end of the analysis but it would be a good beginning.
I’d also like to see a more direct analysis to go along with the instrumental variable model. You can think of the instrument has having a joint effect on the intermediate and final outcomes.
Finally, the seriousness of the topic aside, I can’t helped but be amused by the authors’ use of econ-jargon. As everybody knows, in an applied micro paper you can’t just run the regression and give your results, you have to start with a theoretical model. Which in this case begins with, “For a crime to happen, we need (at least) two individuals meeting each other.” What about burglary??
On the next page we see the delightful expression “dp/dporn,” which actually looks even better in real life because the d’s are those curly partial-derivative d’s and the first p is a rho. OK, here’s the full version; read it and weep:
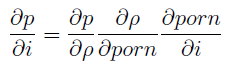
Also, “most of what we know about dp/dporn is either circumstantial or anecdotal.”
All this theory doesn’t really hurt any, but I think it all comes down to the data analysis.
Disclaimer: This page contains affiliate links. If you choose to make a purchase after clicking a link, we may receive a commission at no additional cost to you. Thank you for your support!

Leave a Reply