“With the passage of Cap and Trade there is a good chance that unemployment will be worse than 1933 by the end of 2010.”
So writes an Econbrowser reader. Well, anything can happen, but that is not the outcome I predict. Nor the CBO, EPA, and other informed analysts.
From the CBO:
The incidence of the gains and losses associated with the cap-and-trade program in H.R. 2454 would vary from year to year because the distribution of the allowance value would change over the life of the program. In the initial years of the program, the bulk of allowances would be distributed at no cost to various entities that would be affected by the constraint on emissions. Most of those free allocations would be phased out over time, and by 2035, roughly 70 percent of the allowances would be sold by the federal government, with a large share of revenues returned to households on a per capita basis. This analysis focuses on the effect of the legislation in the year 2020, a point at which the cap would have been in effect for eight years (giving the economy time to adjust) and at which the allocation of allowances would be representative of the situation prior to the phase-down of free allowances. The incidence of gains and losses would be considerably different once the free allocation of allowances had mostly ended. Although the analysis examines the effects of the bill as it would apply in 2020, those effects are described in the context of the current economy –that is, the costs that would result if the policies set for 2020 were in effect in 2010.
On that basis, the Congressional Budget Office (CBO) estimates that the net annual economywide cost of the cap-and-trade program in 2020 would be $22 billion — or about $175 per household. That figure includes the cost of restructuring the production and use of energy and of payments made to foreign entities under the program, but it does not include the economic benefits and other benefits of the reduction in GHG emissions and the associated slowing of climate change. CBO could not determine the incidence of certain pieces (including both costs and benefits) that represent, on net, about 8 percent of the total. For the remaining portion of the net cost, households in the lowest income quintile would see an average net benefit of about $40 in 2020, while households in the highest income quintile would see a net cost of $245. Added costs for households in the second lowest quintile would be about $40 that year; in the middle quintile, about $235; and in the fourth quintile, about $340. Overall net costs would average 0.2 percent of households’ after-tax income.
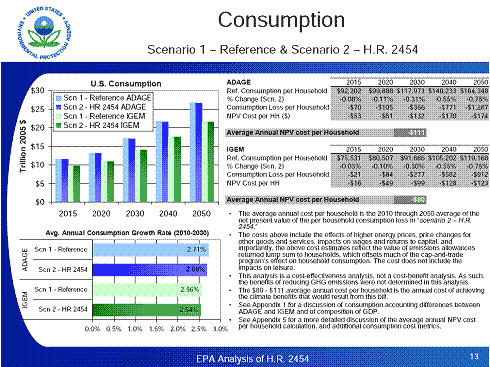
The cap & trade policy has a relatively modest impact on U.S. consumers assuming the bulk of revenues from the program are returned to households.
- Average household consumption is reduced by 0.03-0.08% in 2015 and 0.10-0.11% in 2020 and 0.31-0.30% in 2030, relative to the no policy case.
- Average household consumption will increase by 8-10% between 2010 and 2015 and 15-19% between 2010 and 2020 in the H.R. 2454 scenario.
- In comparison to the baseline, the 5 and 10 year average household consumption growth under the policy is only 0.1 percentage points lower for 2015 and 2020.
- Average annual household consumption is estimated to decline by $80 to $111 dollars per year* relative to the no policy case. This represents 0.1 to 0.2 percent of household consumption.
- These costs include the effects of higher energy prices, price changes for other goods and services, impacts on wages and returns to capital. Cost estimates also reflect the value of some of the emissions allowances returned to households, which offsets much of the cap and trade programs effect on household consumption. The cost estimates do not account for the benefits of avoiding the effects of climate change.
- A policy that failed to return revenues from the program to consumers would lead to substantially larger losses in consumption.
While this analysis contains a set of scenarios that cover some of the important uncertainties when modeling the economic impacts of a comprehensive climate policy, there are still remaining uncertainties that could significantly affect the results.
*Annual net present value cost per household (discount rate = 5%) averaged over 2010-2050 under the core scenario.
Here’s a set of graphs and figures detailing these results.
Slide 13 from EPA Analysis of the American Clean Energy and Security Act of 2009 H.R. 2454 in the 111th Congress (6/23/09).
Of course, this tabulation only includes the costs. In order to do a benefit-cost analysis, one would need to know the benefits of avoiding global climate change associated with green house gas emissions. CBO has its recent analysis Potential Impacts of Climate Change in the United States (May 2009).
Despite the wide range of projected impacts of climate change over the course of the 21st century, published estimates of the economic costs of direct impacts in the United States tend to be modest.110 Most of the economy involves activities that are not likely to be directly affected by changes in climate. Moreover, researchers generally expect the U.S. economy to grow dramatically over the coming century, mainly in sectors (such as information technology and medical care) that are relatively insulated from climate effects. Damages are therefore likely to be a smaller share of the future economy than they would be if they occurred today. As a consequence, a relatively pessimistic estimate for the loss in projected real (inflation-adjusted) U.S. gross domestic product is about 3 percent for warming of about 7 degrees F by 2100. 111
However, such estimates tend to mask larger losses in subsectors of the economy. Some sectors in certain regions are likely to bear sizable costs requiring significant adjustments and adaptations, and a few sectors in a few regions may be eliminated altogether. Even at the low end of the projected range of warming, for example, changing winter conditions would cut the Western ski season by up to four months and would virtually eliminate the Eastern snowmobiling season.112
…
The most comprehensive published study includes estimates of nonmarket damages as well as costs arising from the risk of catastrophic outcomes associated with about 11 degrees F of warming by 2100. That study projects a loss equivalent to about 5 percent of U.S. output and, with substantially larger losses in a number of other countries, a loss of about 10 percent of global output.116
CBO has many of its analyses compiled here; EPA here. EIA has collected its analyses of previous climate change and other legislation here.
Waxman-Markey and the Great Depression II?
Disclaimer: This page contains affiliate links. If you choose to make a purchase after clicking a link, we may receive a commission at no additional cost to you. Thank you for your support!

Leave a Reply