Initial Claims for Unemployment Insurance fell by 10,000 last week to 382,000. However, last week was revised up by 4,000, so one could see it as a 6,000 decrease. This was a bit better than the expected level of 386,000.
The trend in initial claims is downward, although there have been some bumps along the way. The weekly numbers, after an erratic few months, seem to have broken decisively to the downside. First the holidays and then the bad weather seemed to have played havoc with the weekly numbers, but those effects should have passed by now. Let us hope the decline continues next week.
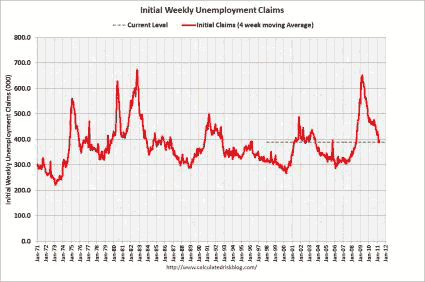
Keeping Below the 400K Level
We managed to remain below the 400,000 level of new jobless claims. If we can stay below it, probably signals the start of much more robust job growth. We have gotten out of the “trading range” that initial claims were in for almost all of 2010. Initial claims had been generally trending down since they hit a secondary peak of 504,000 (after revisions) on August 14, 2010.
Since claims can be volatile from week to week, it is better to track the four week moving average to get a better sense of the trend. It fell by 5,750 to 389,500. As far as the domestic economy is concerned, robust job creation has been the last big part of the puzzle to fall into place. If it can withstand the pressures from government budget cuts, the disaster in Japan and the increased oil prices is an open question. Right now things are starting to look better on the jobs front. Relative to a year ago, the 4-week average is down by 72,500 or 15.7%.
The economy is growing, but is only starting to add a significant number of jobs and to put a dent in the huge army of the unemployed. The March employment report was encouraging, but we still have a very long way to go. We added a total of 216,000 jobs according to the establishment survey, as the private sector total of 230,000 was offset by the loss of 14,000 jobs in State and Local government.
The unemployment rate dipped to 8.8% from 8.9%. January and February both had net positive revisions, with private sectors jobs revised up more than public sector jobs were revised down.
While the monthly decline in the rate was probably due to rounding, it did indicate that the massive plunge in the prior two months was for real. The two-month drop in the unemployment rate from November to January was the largest since 1958! We clearly have some momentum in the jobs market.
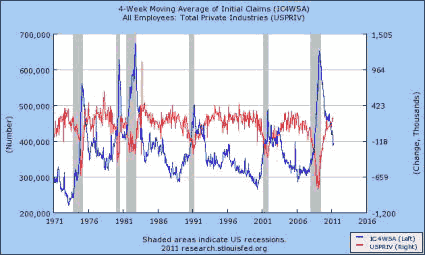
So why is the 400,000 level so significant? The next graph shows why. Historically that has been the inflection point where the economy starts to add a lot of jobs. It layers over the monthly gain or loss in private sector jobs (red line, right hand scale). Unfortunately, the automatic scaling did not put a line at zero for the job growth line, so you will have to eyeball it a bit.
However, notice the strong inverse correlation between job growth and initial claims, and how when the blue initial claims number is below the 400,000 level that job growth is strong.
Continuing Claims
The data on regular continuing claims was also mixed. Regular continuing claims for unemployment insurance fell by 9,000 to 3.723 million. That was after a big upward revision, so it is possible to see it as an increase of 9,000. Still, the overall trend is in the right direction. They are down by 906,000 or 19.6% from a year ago.
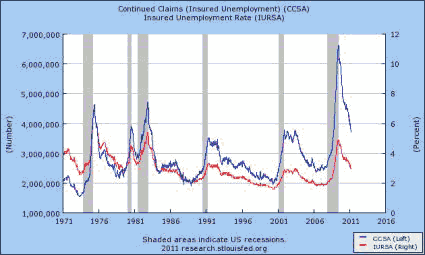
Regular claims are paid by the state governments, and run out after just 26 weeks (although several states have lowered the number of weeks they are going to pay in the future recently). The next graph shows the long term history of continuing claims for unemployment, as well as the percentage of the covered workforce that is receiving regular state benefits.
It does a good job of showing just how nasty that the Great Recession was for the job market. It also shows how things at the regular state unemployment benefit level have been getting much better over the last year (but still well above the peaks of the last two recessions.
Note that the insured unemployment rate generally follows the direction of the number of claims, but has been gradually diverging over time. That is a function of the overall growth of the labor force, and of tighter eligibility standards for getting unemployment insurance over time. It also reflects the fact that this time around a very large proportion of those getting unemployment benefits are getting them from the extended Federal programs, not from the regular state programs.
In March, half of all the unemployed had been out of work for 21.7 weeks (down from a record high of 25.5 weeks in June, but up from 21.2 weeks in February), and 45.5% had been out of work for more than 26 weeks. Just for a point of perspective, prior to the Great Recession, the highest the median duration of unemployment had ever reached was 12.3 weeks near the bottom of the ’82-83 downturn.
Clearly a measure of unemployment that by definition excludes 45.5% of the unemployed paints a very incomplete picture. The number of short-term unemployed (less than 5 weeks) was actually exceptionally low. The problem in terms of employment is not a lot of firing, but a lack of hiring. This has been the case for some time now.
Extended Benefits
After the 26 weeks are up, people move over to extended benefits, which are paid for by the Federal government. While regular claims are down, it is in large part due to people aging out of the regular benefits and “graduating” to extended benefits. Unfortunately, the data on extended claims in prior recessions is not available at the St. Louis Fed database. However, given the extraordinary duration of unemployment, it is a safe bet that they are higher than in previous downturns.
The extended claims have also been trending down, but it has been a bumpy decline. They (the two largest programs combined) fell by 91,000 to 4.271 million this week. Relative to a year ago they are down 1.467 million or 25.6%. A much better measure is the total number of people getting benefits, regardless of which level of government pays for them. Combined, regular claims and extended claims (including a few much smaller programs) fell by 246,000 on the week and are down 2.543 million or 23.0% over the last year.
(The extended claims numbers are not seasonally adjusted, while the initial and continuing claims are, so there is always little bit of apples-to-oranges. In addition, the continuing claims data are a week behind the initial claims, and extended claims are a week behind the extended claims data.)
Even with the deal that extended unemployment benefits for this year in exchange for continuing the top end of the Bush tax cuts, people will still “graduate” from the system after 99 weeks, but people will continue to be able to move to the next tier up to the 99 week limit. Extended benefits are in four different tiers, so if benefits had not been extended, some people would have lost their benefits after just 39 weeks of being out of work.
The key point, though, is that the year-long extension does not mean that some people will be getting benefits for a total of 151 weeks, as is sometimes thought.
Tax Cuts Creating Higher Deficit
The downside to the deal was that it will reverse the downward trend in the budget deficit and cause the deficit to be higher in fiscal 2011 than it was in fiscal 2010, and is now projected to exceed the 2009 record deficit. The extended benefit portion of the deal was not the main reason the deficit is going up, the extension of the high-end Bush tax cuts, and particularly the 2% payroll tax holiday played a bigger role.
The fiscal stimulus from the payroll tax cut is being undermined by attempted cuts in other domestic government spending. If the draconian House spending cuts of $61 billion for the last half of fiscal 2011 were to be enacted, the result will be a slower economy and hundreds of thousands of fewer jobs in the economy. That, in turn, will significantly undermine the deficit reduction that is the supposed aim of the exercise.
Many of the cuts, such as a $600 million cut for the IRS, do not seemed to be designed to reduce the budget deficit anyways, but to accomplish other objectives. Given the refusal to accept any form of revenue increase, I really do not think that they are serious about deficit reduction, it is just a cover for other goals. A government shut down next week remains a real possibility.
While the employment picture is starting to get better, in any absolute sense it is still just plain awful. I find it astounding that aside from making political points, nobody in Washington seems to care anymore. The policies that are being debated are all things that would slow the economy, not speed it up.
The one exception is the Federal Reserve, which is doing its part by keeping rates low and by using quantitative easing. While that helps a little bit, it is also much less effective than fiscal stimulus would be. Right now monetary policy is sort of “pushing on a string.”
Extended Benefits = Fiscal Stimulus
Some claim that the long duration of unemployment benefits has actually discouraged people from looking for work. That is, people are content to live forever on 60% of their previous income, or $400 per week, whichever is lower. The average benefit is only about $300 a week. Ask yourself, how well could you live on $300 per week?
Right now (well as of the January JOLTS data) there are almost five people out of work for each job opening. Just telling all of them to “get a job” isn’t going to work. The extension of benefits is one of the key reasons that initial claims are falling. While that may sound counter-intuitive, it is because extended benefits are a very effective form of economic stimulus.
Extended unemployment benefits are, dollar of dollar, one of the most effective forms of economic stimulus there is. It is a pretty good bet that the people losing their extended benefits have depleted their savings and run up all the debt they can in trying to make ends meet. The maximum unemployment benefit works out to be just $20,800 per year, or less than the poverty line for a family of four. You think any of those people have been able to sock any of that away?
There is a concern that by cushioning the blow of unemployment, people might be more reluctant to take a marginal job opportunity, but a below poverty-level income is not that much of a cushion. I’m not sure it is good for the economy for highly skilled people to be taking jobs in other fields that have no use of those skills, and then be unavailable when those skills are needed again.
The people who get extended benefits tend to spend the money quickly on basic needs. This in turn keeps customers coming in the door at Wal-Mart (WMT) and Family Dollar (FDO). It means that, at the margin, some people are able to continue to pay their mortgages and thus helps keep the foreclosure crisis from getting even worse than it already is.
However, by the time they are well into extended benefits, they might also be spending food stamps as well as the unemployment check at Kroger’s (KR). These customers keep the people at Wal-Mart, Family Dollar and Kroger’s, and of course their competitors, employed. It also keeps the people who make and transport those goods employed as well, although in that case much of the stimulus is lost overseas if the goods are imported.
Who Demands Imports More – Rich or Poor?
It is not clear if the marginal propensity to import is higher for poor (or temporarily poor because they are unemployed) or for the rich. Lots of the stuff on the shelves of Wal-Mart comes from China. On the other hand, the poor are not likely to be buying Swiss watches or German autos. They will not be buying absolutely frivolous things like water imported from halfway around the world (Fiji water).
What is clear is that they will spend it quicker, increasing the velocity of money, than will the rich who will tend to save more of it, particularly if they see the increased income from say a continued tax cut for the highest income people as temporary. The rich are much more likely, in other words, to fit Milton Friedman’s “Permanent Income Hypothesis” than are the unemployed, since the rich do not face liquidity constraints.
Also, if you remember your Friedman, velocity of money counts, and it counts a great deal. P * Q = M * V. Price times quantity in the aggregate is nominal GDP, and it is equal to the amount of money in circulation times how quickly it changes hands. Money in the hands of the unemployed has a much higher velocity than money in the hands of a multi millionaire.
Getting New Jobs or Receiving More Benefits?
There really is not good way to tell from this report if the decline in the number of people receiving benefits is due to them getting new jobs, or due to even the extended benefits running out. If it is the former, it is very good news. If it is the latter, it just means more people are falling into absolute destitution. That is not good news for either the economy or for social stability. Both the very high unemployment duration numbers and the very low civilian participation rate (unchanged at 64.2% in March, but down from 64.9% a year ago), would suggest that it is the unhappy latter case that is happening.
The longer-term trend is very much in the right direction. The 4-week average staying below the 400,000 level is a very encouraging sign. In the last two recoveries, when it got below that threshold, that job creation really started to take off. If it stays there, we will climb the Stairway to Heaven of a rapidly falling unemployment rate. If it shoots above 500,000 then we are on the Highway to Hell. The current level provides a hope that we have escaped the purgatory of a pseudo recovery.
Initial claims edged down as did continuing claims, but only by virtue of big upward revisions to the prior week. I don’t think this report will change anyone’s expectations for the big number tomorrow. Still, relative to where we were just a few months ago, all numbers still look pretty good.
FAMILY DOLLAR (FDO): Free Stock Analysis Report
Disclaimer: This page contains affiliate links. If you choose to make a purchase after clicking a link, we may receive a commission at no additional cost to you. Thank you for your support!


Leave a Reply