As James Morley has pointed out, often a sharp economic downturn is followed by an equally sharp economic recovery. One reason for that is the liquidation of inventories that accompanies any recession and restocking that takes place in recovery. What should we expect this time?
The graph below shows inventory investment as a percentage of U.S. GDP since 1947. There’s been an improvement over time in inventory management, which I captured with a downward-sloping linear time trend. [Incidentally, this graph and many of the calculations that follow are constructed using the original nominal magnitudes. You can make mistakes looking at a number like the ratio of real inventory investment to real GDP since the respective deflators are different, whereas the ratio of two nominal magnitudes is always in correct natural real units, namely, percent of GDP.]
Black line: 100 times the ratio of additions to inventories (nominal dollar value) to nominal GDP, 1947:Q1 to 2009:Q1. Data source: BEA Table 1.1.5. Blue line: linear time trend. Shaded regions: NBER recessions.
The typical pattern is for inventory investment to fall well below trend during an economic downturn. The cumulative drawdown of inventories since the current recession began in 2007:Q4 amounts to 0.58% of one year’s GDP. The time trend suggests that, in the absence of a recession, we might have expected inventory investment to have been about 0.22% of GDP, and building inventories at that normal rate would have justified an increase in inventories over the last 6 quarters whose value would amount to 1.5 x 0.22 = 0.33% of one year’s GDP. In other words, according to these calculations the level of inventories is lower than you would have expected in the absence of a recession by about 0.33 + 0.58 = 0.91% of one year’s GDP. Add that restocking to the normal 0.21% inventory investment that we’d expect from the time trend as of 2009:Q3, and you get a possible contribution of inventory investment of 0.91 + 0.21 = 1.12% of GDP during the first year of the recovery.
If we are looking at the growth rate of real GDP, which is how we usually think about these numbers, the potential contribution of inventory investment is even more dramatic. If inventory investment goes from subtracting 0.49% from GDP (as it did over the last 4 quarters) to adding 1.12% to GDP (as I’m arguing it could well over the first four quarters of the recovery), the contribution to the growth rate of real GDP would be 1.12 – -0.49 = 1.61%.
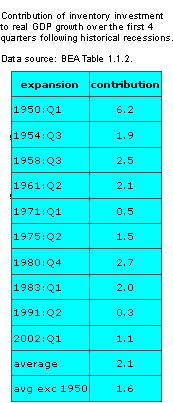 How plausible is such a number? The table at the right reports the average contribution of inventory investment to real GDP growth over the first 4 quarters of each of the previous 10 expansions. Inventories made a positive contribution in every case, giving an average kick to real GDP growth of 2.1%. However, that average is heavily influenced by the outlier associated with the Korean War. Leaving 1950 out, inventories contributed an average of 1.6% to real GDP growth in the first year of previous expansions, exactly the amount I’m claiming they might be expected to contribute this time as well. That calculation reflects both the fact that the inventory liquidation this time has been more significant than in an average recession (on which basis you’d expect inventory restocking this time to be bigger than average) and the time trend’s presumed decrease in the desired ratio of inventory investment to GDP (on which basis you’d expect inventory restocking this time to be smaller than average). From my quick calculations, those two factors exactly balance each other out, and I would expect inventory investment to be able to make the same significant contribution it has made in previous recoveries.
I have reviewed this potential for inventory investment, but similar dynamics also apply to a number of other components of GDP. For example, recent sales levels for motor vehicle appear to be significantly below normal scrappage rates, and this is another area where a big rebound effect is quite possible.
So why would anyone predict anything other than a robust rebound? General Electric Co. Vice Chairman John Rice expressed the core concern:
We see a world where good companies and good consumers can’t get all the credit we would like,” Rice said. “Companies with lots of cash on their balance sheet are worried about whether they will get what they need for working capital” and are cutting spending. “Until that changes I don’t think you will see a significant rebound,” Rice said. “We are preparing for 12 or 18 months of tough sledding.”
The question is whether our financial system is willing and able to extend the credit that would fuel the recovery. The key battering ram so far has been the deterioration in the value of residential-mortgage-backed securities aggravated by the collapse in real estate prices, which collapse could easily continue. Calculated Risk doesn’t share the enthusiasm over the latest house price numbers:
So house prices were falling at about a 10% annualized rate in April– and that apparently feels like “stabilization”!
And there are other shoes yet to drop on the financial system, including commercial real estate as 1 in 5 U.S. hotels may default and credit card debt.
Will we see a robust recovery? I can’t rule it out. But personally, I’ll believe it when I see it.
Disclaimer: This page contains affiliate links. If you choose to make a purchase after clicking a link, we may receive a commission at no additional cost to you. Thank you for your support!

Leave a Reply