In February 2001, nonfarm payrolls hit their business cycle peak of 132.5 million. Ten years later, the latest data pegs February 2011 payrolls at 130.5 million, a 1.5% decline. To put this in perspective, the ten-year period of the Great Depression, 1929-39 saw a 2.3% decline in nonfarm employment, roughly the same magnitude.
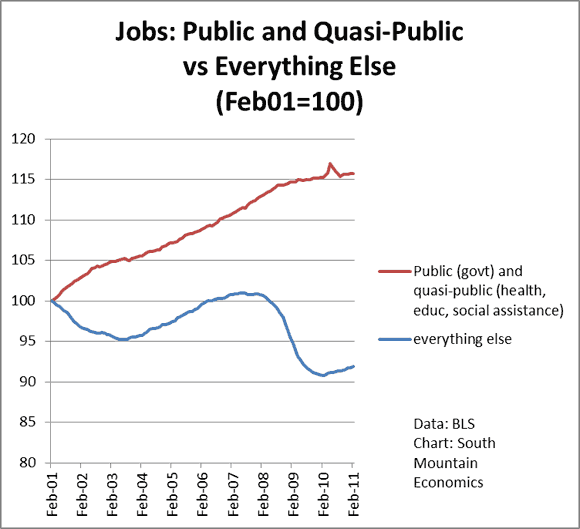
But even that 1.5% understates the extent of the pain for most of the workforce. I divide the economy into two parts. On the one side are the combined public and quasi-public sectors, and on the other side is the rest of the economy. Public, of course, refers to government employees. ‘Quasi-public’, a term I just invented, includes the nominal private-sector education, healthcare, and social assistance industries. I call them ’quasi-public’ because these industries depend very heavily on government funding. For example, social assistance includes ‘child and youth services’ and ‘services for the elderly and disabled’, which are often provided under government contract.
The chart below shows employment growth in the public/quasi-public sector, compared to employment growth in the rest of the economy, with February 2001 set to 100. We can see that public/quasi-public employment rose steadily over the past ten years, and is now up 16%. By comparison, the rest of the private sector is down 8% in jobs over the past 10 years.
Once again, we look at the Great Depression for an analogy. From 1929 to 1939, government employment rose by about 30%. If we back that out, then private sector non-ag jobs fell by 6% over the Depression decade. That compares to the contemporary 8% decline in private non-ag non-quasi-public jobs since 2001. So by this measure, the past 10 years have been worse for the labor market than the decade of the Great Depression.
Now let’s look by state. I put the chart beneath the fold, because it’s long and weird and I’m not sure if it going to come out right.
Here it is. This chart reports on the percentage change of private employment by state over the past ten years, leaving out the quasi-public sector.
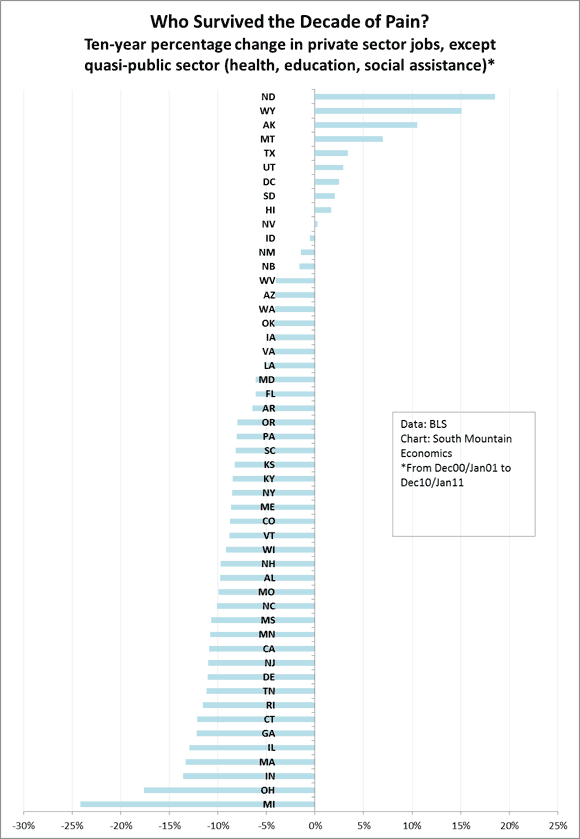
The worst hit states, not surprisingly, are Michigan, Ohio, and Indiana. Massachusetts has a big decline as well, though I’m not sure that it’s fair to remove healthcare and education, which have always been primary drivers of the MA economy. Then we have some surprises, including CT and NJ. NY, At the other end, some of the natural resource states show job gains over the decade, as did DC, even after removing govt jobs.
Disclaimer: This page contains affiliate links. If you choose to make a purchase after clicking a link, we may receive a commission at no additional cost to you. Thank you for your support!


Leave a Reply