The Trade Deficit rose in January to $46.34 billion from $40.26 billion in December (revised down from $40.58 billion). The rise in the trade deficit is very bad news for the economy. Not only did it soar by 15.1% on the month, it was also much worse than the $41.50 billion consensus expectation.
On a year-over-year basis, the total trade deficit was up 33.7% from $34.65 billion a year ago. The trade balance has two major parts: trade in goods and trade in services. America’s problem is always on the goods side; we actually routinely have a small surplus in services.
Relative to December, the goods deficit rose to $59.75 billion from $53.63 billion. That is a month-to-month increase of 11.4%. Relative to a year ago, the goods deficit was up 26.8% from $47.11 billion. The Service surplus was up slightly from December to $13.41 billion from $13.36 billion. Relative to a year ago it is up 7.6% from $12.46 billion.
Exports of goods increased by $3.99 billion, or 3.4%, for the month to $120.50 billion. Relative to a year ago, goods exports are up 19.8%.
Doubling Exports Goal On Track
In other words, we are easily on pace to meet President Obama’s goal of doubling exports of goods over the next five years. Service exports, on the other hand, were up only 1.0% for the month, and were up 6.9% year over year, which is well short of the pace needed to double over five years (just under 15%). Total exports rose 2.7% for the month and are up 15.9%, just a little ahead of the pace needed to double over five years.
Doubling exports over five years is all well and good, but not if we also double our imports over the same time frame. After all, it is net exports which are important to GDP growth, and to employment. The monthly numbers were very discouraging in this regard, as goods imports rose by $10.09 billion, or 5.9% to $180.23 billion.
Relative to a year ago, goods imports were up by $32.57 billion, or by 22.05%. At that pace, they are closer to the pace needed to triple over five years than double over five years. Service imports were up by $41 million on the month or 1.2%. Total imports grew by $10.52 billion or 5.2% for the month to $214.08 billion and are up 19.3% year over year.
Given that imports are starting from a higher base, doubling both imports and exports would mean a substantial increase in the size of the trade deficit. Put another way, in January we bought from abroad $1.50 worth of goods for every dollar of goods we sold. That was a deterioration from the $1.46 worth of stuff in December, and from $1.47 a year ago. Including services, we imported $1.28 for every dollar we exported, up from $1.25 in December and from $1.24 a year ago.
Trade Deficit Up Nearly 33%
For all of 2010, the total trade deficit is up an astounding 32.8% to $497.82 billion, with the goods deficit up 27.5% to $646.54 billion, some what offset by the service sector surplus rising 12.0% to $147.82 billion. Trade in goods simply swamps trade in services, even though services are a much larger part of the overall economy.
All things being equal, it is better to see trade going up than down. We want to see both exports and imports growing, but given the massive deficit we are running, we need to have exports rise dramatically faster than imports, or actually see imports fall. From a purely nationalistic point of view, rising exports or falling imports are roughly equivalent in terms of economic growth. Falling imports though implies economic pain in some other countries.
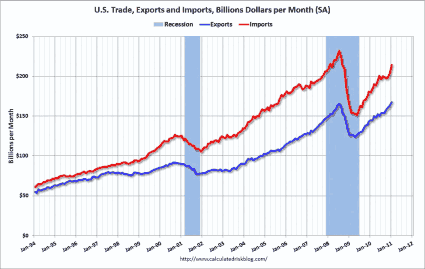
Thus, all else being equal, it would be better if most of the improvement in the trade deficit came from rising exports rather than falling imports. A big part of what made the Great Recession into a global downturn was an absolute collapse in global trade. This can clearly be seen in the long-term graph of our imports and exports below (from http://www.calculatedriskblog.com).
Falling imports and exports are clearly associated with recessions. In the Great Recession our imports collapsed faster than our exports, and so we had a very big improvement in the trade deficit.
Falling imports were just about the only thing keeping the economy on life support during those dark days. For example, in the first quarter of 2009 the smaller trade deficit increased growth by 2.64%. If not for that, the economy would have shrunk by 9.0% instead of by 6.4%.
Thus, growing world trade is a good thing, but not if it comes at the expense of an ever-rising U.S. trade deficit. In other words, all things else are not equal. Had it not been for a dramatic deterioration in the trade deficit in the second quarter of this year, GDP growth would have been over 5.2%, not 1.7%. In the third quarter it would have been 4.3% rather than 2.6%.
The drop in the trade deficit in October and November was one of the most powerful forces behind the growth we saw in the fourth quarter. Without the improvement in net exports, the economy would have actually shrunk by 0.6%, rather than growing by 2.8%.
Clearly it matters a great deal if the trade deficit is growing or shrinking. The rise in the trade deficit in January would seem to indicate that first quarter GDP growth forecasts will have to be revised down.
Trade Deficit More Crucial than Budget Deficit
The trade deficit is a far more serious economic problem, particularly in the short-to-medium term, than is the budget deficit. The trade deficit is directly responsible for the increase in the country’s indebtedness to the rest of the world, not the budget deficit. That is not just a matter of opinion, that is an accounting identity.
Think about it this way, during WWII the Federal Government ran budget deficits that were FAR larger as a percentage of GDP than we are running today, but we emerged from the war the biggest net creditor to the rest of the world that the world had ever seen up to that point. Then the Federal government owed a lot of money, but it owed it to U.S. citizens, not to foreign governments.
Slowly but surely the trade deficit is bankrupting the country. While most of the foreign debt is in T-notes, try think of it as if we were selling off companies instead of T-notes. This month’s trade deficit is the equivalent of the country selling off Union Pacific (UNP), while last month’s deficit was the equivalent of selling off Eli Lilly (LLY). How long would it take before every major company in the U.S. was in foreign hands if this keeps up?
Put another way, the 2010 trade deficit has totaled $497.82 billion, which is 64% what all the firms in the S&P 500 earned, worldwide, in 2010 (assuming those S&P 500 firms that have yet to report their fourth quarter results come in exactly in line with expectations).
Goods Deficit: Oil & Non-Oil
The goods deficit has two major parts: that which is due to our oil addiction and that which is due to all the stuff that line the shelves of Wal-Mart (WMT).
Of the total goods deficit of $59.75 billion, $26.66 billion, or 44.6% is due to our oil addition. Relative to the overall trade deficit, our oil addiction is 67.5% of the problem. For all of 2010, we ran a $265.12 billion deficit just from petroleum. That is equivalent to the combined market capitalizations of Chevron (CVX), Marathon Oil (MRO) and Apache Energy (APA).
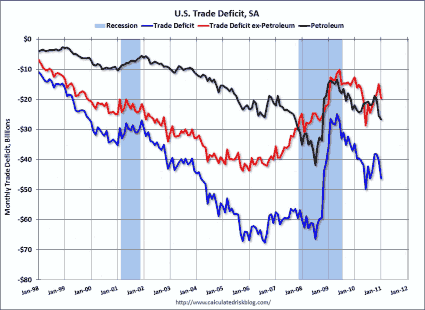
The second graph (also from http://www.calculatedriskblog.com/) breaks down the deficit into its oil and non-oil parts over time. It shows that the overall trade deficit (blue line) deteriorated sharply from 1998 to mid-2005 and then remained at just plain awful levels until the financial meltdown caused world trade to come to a screeching halt. That caused a major but unfortunately short lived improvement in the overall deficit.
However, the stabilization in the non-oil deficit started about two years earlier, but that was offset by the effects of soaring oil prices which caused the oil side of the deficit to deteriorate sharply.
The monthly deterioration in the goods deficit came mostly from the non-oil side. That is a very bad sign for coming months, as oil prices really shot up during February. The oil deficit was up by $1.22 billion or 4.7%. Relative to a year ago, the oil deficit was up 21.5% or $4.71 billion. On the non-oil side, the deficit rose to $32.02 billion from $27.01 billion in December, and 31.8% above the $25.43 billion level of a year ago.
The oil side should be the low-hanging fruit to bring down the overall trade deficit and thus help spur economic growth. Oil is primarily used as a transportation fuel. The technology exists and is widely used abroad to use natural gas to power cars and trucks. Thanks to the emerging shale plays, we have ample domestic supplies of natural gas, and on a per BTU basis, natural gas is selling for the equivalent of oil at $22.92 per barrel.
We need to get past the “chicken and the egg” problem of nobody wanting to buy a natural gas powered vehicle because there are no convenient places to refuel, and gas stations’ reluctance to install refueling stations for natural gas-powered vehicles since there are not many of them on the road. Not only would such a move save money for drivers in the long run (there is an upfront capital cost as natural gas powered engines are more expensive than regular gasoline powered engines), but it would substantially reduce our trade deficit.
Since it is a domestically produced fuel (and most of what we do import is from Canada), there is also a huge national security argument for moving to using more natural gas. The dollars we send abroad to pay for oil imports are simply the tip of the iceberg when it comes to the overall cost of oil. A substantial portion of the Pentagon budget is devoted to keeping the oil flowing in the Middle East and the sea routes open. While I don’t think that oil was the only reason for our being in Iraq, it is clearly a significant factor.
Natural gas is also a much cleaner fuel and emits far less CO2 than does gasoline (and almost no other pollutants other than CO2). Thus it would be a very useful step towards stopping global warming. Doing this, especially breaking the “chicken and the egg” problem will take federal government leadership. The benefits for the economy however, would be huge.
It seems inevitable to me that it will eventually happen, and when it does, it will be a great boon to major natural gas producers like Chesapeake (CHK) and EnCana (ECA). The timing of it happening is very uncertain, but the sooner it happens, the better. I don’t want to minimize the cost of doing so, particularly in terms of water quality. We need to do more research on the chemicals used in fracking operations to get at the shale gas (starting with getting rid of the trade secrets provision that allows the firms to hide exactly what they are putting into the ground and potentially the groundwater).
Strong environmental regulation is needed of the shale gas operations, but it should be possible to both protect the environment and get the gas out of the ground. Yes there would still be an environmental risk, but we need to take some risks, and the risk of not using the natural gas resource seems greater. It strikes me as a trade-off worth making.
A Weak Dollar Would Help
The best thing that could happen to help on the non-oil side of the trade deficit would be for the dollar to fall (particularly against the Chinese Yuan, but against other currencies as well). The weak dollar not only makes imports cheaper, it makes our exports more attractive. The rise in the non-oil deficit in the face of the recent decline in the dollar is especially disappointing, but there is often a lag between currency movements and changes in trade patterns.
However, a weak dollar will not do anything for the oil side of the deficit. There are few correlations that are stronger in the market over the last few years than oil prices rising when the dollar falls and vice versa. Not quite to the relationship between rising bond yields and falling bond prices, but pretty close.
It is not just a direct effect of say our being able to sell more goods in Japan because the dollar is weak relative to the yen, but U.S. companies are often in direct competition with Japanese or European companies in selling to third countries. For example, both General Electric (GE) and Siemens (SI) make MRI machines for hospitals. Assuming that they were of roughly equal quality, then when the Euro rises sharply against the dollar, GE is going to be able to undercut Siemens for export orders to China.
By country, we ran some small trade surpluses with Hong Kong, Singapore and Australia, but we continue to run large deficits with most of our other trading partners. The biggest deficit by far is with China, the source of many of the goods on the shelves of Wal-Mart. It rose sharply this month, to $23.3 billion from $20.7 billion in December. That is 50.2% of our overall trade deficit.
While China has agreed to let the Yuan appreciate, so far it has done so at only a glacial pace. However, higher inflation in China than in the U.S. means that the real exchange rate is improving somewhat faster than that. Our deficit with the European Union fell this month to $5.6 billion, from $6.6 billion.
We saw an increase in our trade deficit with OPEC ($9.9 billion vs. $8.3 billion). Our trade deficit with Mexico rose to $4.9 billion from $4.7 billion, while the deficit with Canada (by far our largest trading partner) fell up to $3.7 billion from $3.9 billion. Canada is our single largest foreign oil supplier. The deficit with Japan fell to $5.0 from $5.9 billion.
A Bleak Report by Any Measure
Overall, this was a very downbeat report, and one that was much worse than expectations. The principal cause was not higher oil prices, but given the spike in oil prices, we should expected significant further deterioration on that front in February.
On the non-oil side, this was not only a substantial deterioration, but it snaps what had been a very positive trend in recent months. The problem is decidedly not on the export side. Refer back to the first graph and you will see that the slope of the export line is much steeper than it was in the previous two economic expansions. The problem is on the import side, which is rising at an even faster rate.
It is the change in the trade deficit that drives GDP growth, not the level. As long as the trade deficit shrinks, it will add to overall growth, even if the level is still awful. A rising trade deficit shrinks the economy on just about a dollar-for-dollar basis. Getting the trade deficit under control has to be one of the top economic priorities. If we do, economic growth will be much higher, and we might actually start to see some significant job creation.
With the rise in employment will come higher tax revenues which will help bring the budget deficit under control. To do that we need to do two things, first get our oil addiction under control. The second is that “King Dollar” is a tyrant and needs to meet the same fate as Charles I and Louis XVI: “Off with his head!”
The Fed seems to understand this, and a weaker dollar is one of the more important mechanisms through which quantitative easing will tend to stimulate the real economy (and is the key reason why we are getting so much criticism about it from the rest of the world, as a decrease in our trade deficit would mean a corresponding decrease in they trade surpluses).
The U.S. can simply no longer afford to be the importer of last resort for the rest of the world. As worldwide, trade deficits and surpluses have to sum to zero (barring the opening of major trade routes to Alpha Centari), a reduction in the U.S. trade deficit has to mean that the trade surpluses of other countries has to fall (or other deficit countries have to run even bigger deficits).
Right now every country in the world is trying to maximize exports and minimize imports. We have to fight that battle as well, but it is a fight where we have been getting our butts kicked for decades now. Continuing to lose the fight could result in near fatal damage to our economy and way of life. As I said before, the trade deficit is a far bigger economic problem than the budget deficit.
The downside of a weaker dollar is that it will tend to push up inflation. However, at this point, deflation is a bigger threat than runaway inflation (although with QE2, the risk of deflation is substantially reduced). That is especially true of core inflation, the non-food and energy part of inflation.
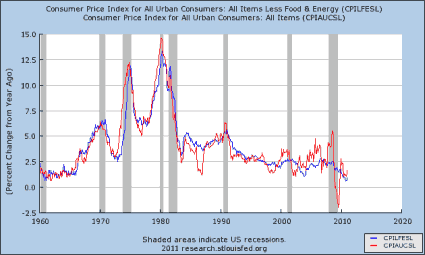
The final graph shows that core inflation (CPI) — which is what the Federal Reserve tends to focus on — is at historic lows. Even including food and energy prices (red line) year over year inflation is still below where it has been for the vast majority of my life. Those who are running around like chickens with their heads cut off yelling about the “debasement of the currency” are completely off-base.
Let’s start worrying about our real problems — we have more than enough of those — rather than imaginary problems. The trade deficit is high on the list of our real problems.
CHEVRON (CVX): Free Stock Analysis Report
Disclaimer: This page contains affiliate links. If you choose to make a purchase after clicking a link, we may receive a commission at no additional cost to you. Thank you for your support!


Leave a Reply