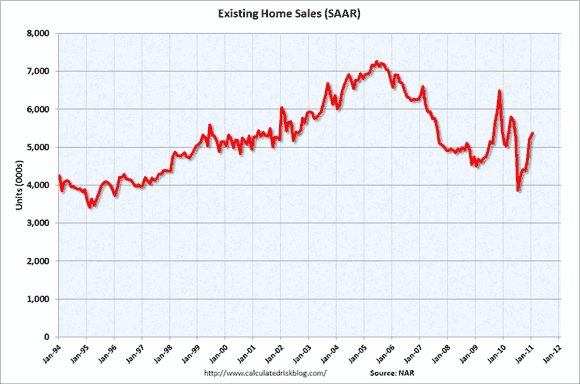
In January, existing home sales ran at a seasonally adjusted annual rate of 5.36 million. That pace is 2.7% higher than in December, and 5.3% above the year-ago rate.
The year-ago rate of 5.09 million was depressed as everyone was rushing to get the deals done in November 2009 before they thought the first time buyer tax credit would expire. The tax credit was unexpectedly extended (and expanded) at the last minute. Thus, take the year-over-year rise with a grain of salt.
The January sales rate was above consensus expectations of a 5.23 million annual rate. On the other hand, December was revised down from an initial read of 5.28 million, so relative to where we thought we were, the month-to-month increase was just 1.5%. The spike a year ago due to the tax credit, along with the secondary spike when the credit actually did expire for real in June, can be seen in the first graph (from http://www.calculatedriskblog.com).
Sales of single family homes rose by 2.4% on the month to a rate of 4.69 million, and are off 2.5% year over year. The median price of a single-family home nationwide slipped 2.7% from a year ago to $159,400. Condo and co-op sales rose 4.7% on the month, and are up 7.9% year over year. The median condo price plunged 10.4% from a year ago to $154,00. For all existing homes the median price was down 3.7% to 158,800.
Sales by Region
Regionally, sales were up on the month in three of the four census regions. The Northeast was the exception, with a 4.6% decline for the month and a 1.2% decline from a year ago. The West had the biggest month-to-month increase with sales rising 7.9%, and were up 7.0% from a year ago. The South, which is by for the largest of the four regions, posted an increase of 3.6% on the month, and are up 8.0% from a year ago. In the Midwest, sales rose 1.8% for the month and are up 3.6% year over year.
The price to be paid for the higher sales was in the form of lower median prices in all four regions. Those ranged from a 2.1% decline in the South to a 5.7% fall in the West, relative to a year ago. While the median price is not the best measure of housing prices over time (changes in the mix of houses being sold can be a significant influence), the price declines are in line with the data we have seen from better home price series like the Case Schiller index (see “Case-Schiller: Home Prices Fall Again”).
Housing Prices & the Economy
The level of activity in used home sales really is not that important in isolation. It is just the transfer of an existing asset, and does not add a lot to economic growth. The one exception to that is realtors commissions. Indirectly, it can help as people will often remodel and redecorate a “new for them” house. That can stimulate some sales for paint companies like Sherwin Williams (SHW) and perhaps it is good for furniture firms like La-Z-Boy (LZB), but it pales compared to the economic activity generated by a new home sale.
New homes not only need new paint on the walls, but they need the walls. That means lots of business for wallboard firms like USG (USG), timber firms like Weyerhaeuser (WY) and roofing and insulation firms like the Johns Manville division of Berkshire Hathaway (BRK.B). It also means that those firms have to hire more workers, so the employment effect of new home sales goes well beyond the roofers and carpenters actually on the jobsite.
Where used home sales are important is in relation to the inventory of houses for sale. That will influence the future direction of hosing prices. Used home prices are extremely important. As used home prices fall, more and more people find themselves underwater on their mortgages. As long as a homeowner has positive equity in their house, the foreclosure rate should be zero. After all, it is better to simply sell the house and get something for it, rather than simply let the bank take it and get nothing for it.
The more people under water, and the deeper they are, the higher foreclosures and strategic defaults are going to be. A strategic default is when someone has the cash flow available to continue to make his mortgage payment, but simply decides not to, since paying is a just plain stupid thing to do from a financial perspective. If you have a house that could only sell for $150,000 n the current environment, and you owe $200,000 on the mortgage, in effect you have the option of “selling” the house to the bank for $200,000 simply by stopping writing the checks.
Of course that will be a hit to your credit rating, but $50,000 is probably worth a bit of a tarnish on your Fico score. If the difference is only $5,000, then the hit to your credit score makes less sense, and there are lots of non-economic factors (a house is, after all, a home, not just an investment) that come into play.
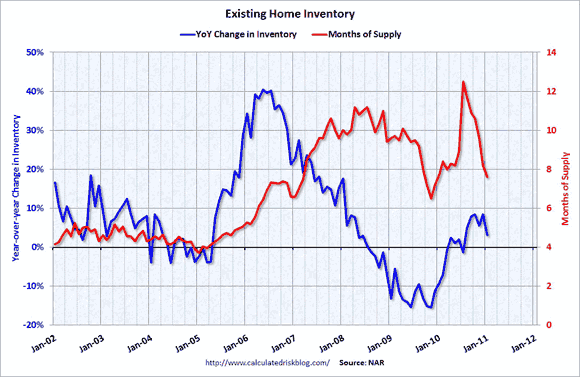
In January, inventories fell by 5.1% to 3.38 million, but remain above the year-ago level. That puts the months of supply at 7.6 months, down from 8.2 months in December, and as high as 12.5 months in June. While moving in the right direction, it is still a pretty high number.
A “normal” months of supply is about six months, and during the housing bubble four months was the norm. Also, the inventory numbers are not seasonally adjusted, even thought here is a seasonal pattern when they tend to decline in the winter (especially around the holidays) and then increase in the spring. The second graph (also from http://www.calculatedriskblog.com) traces the months of supply and the year-over-year change in inventories. The sharp drop in the months supply over the last few months is encouraging, but the level still suggests downward pressure on existing home prices over the next few months.
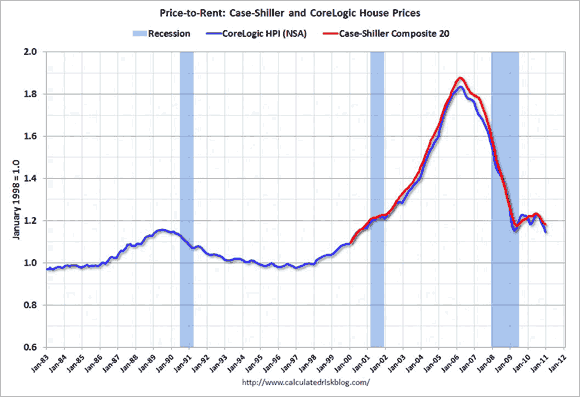
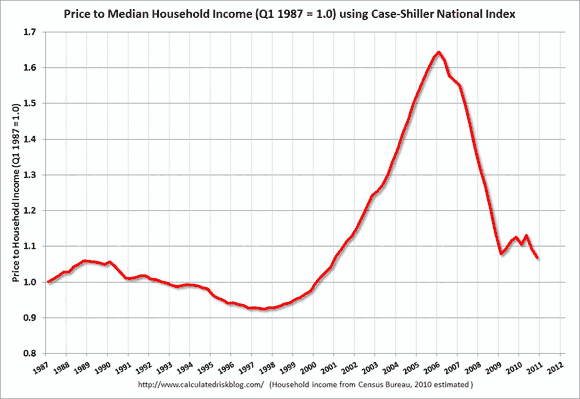
Home Prices Closer to Historic Values
Fortunately, relative to incomes and rents, home prices are not as absurdly overvalued as they were then, so the magnitude of the coming price declines is likely to be a lot less over the next year than the 30% plunge in 2008 and early 2009. I suspect they will fall by about 5% from here. Still, that could do a lot of damage, since the equity cushions are a lot smaller now than they were in 2007 or early 2008. If housing prices fall more than 5%, then all of them will also be underwater, and lots of homes that are only slightly underwater (where non financial considerations tend to dominate) will become deeply underwater.
There are some very well-respected housing economists, including Robert Schiller (creator of the Case-Schiller index), who are far more pessimistic than I about the future of housing prices, thinking prices could drop 20% or more from current levels. While that is possible, especially if the current unrest in the Middle East results in a prolonged period of higher energy prices that substantially slows the overall economy, I do not see that as the most likely case.
The next two graphs (also from http://www.calculatedriskblog.com) track housing prices relative to the two most important drivers of housing prices — rents and incomes. My forecast of a further 5% decline would put prices roughly in the middle of the range where they were in the 1990’s. Dr. Schiller’s would put housing prices at the very low end of that range. I would say the risk is more that Dr. Schiller has it right, rather than we are both wrong (and him very wrong) and housing prices start to rebound in the near term.
“Fraudclosures”
Foreclosures have slowed recently, but that is only because of the fraudclosure scandal, where the banks have proved to be exceptionally incompetent in handling the paperwork related to securitized mortgages. Basically, they can’t really prove that they hold the mortgage, and thus don’t have the right to foreclose.
It remains to be seen just how big a problem that will prove to be. It could just be a technical glitch that will gum up the works for a few months, or it could be a HUGE problem that once again undermines the solvency of the entire banking system. It is a very good reason to avoid bank stocks, especially those like Bank of America (BAC) and Wells Fargo (WFC) where mortgages make up a big part of their business.
What is clear is that what they were doing was illegal and at least technically constituted fraud and misrepresentation to the courts. There should be more than a handful of bankers who end up with long terms in prison as a result. Just because there should, however, does not mean that there will be. White-collar crime is simply not taken seriously in this country relative to blue collar or street crime, even though the amount stolen with a pen far exceeds the amount stolen with a gun. When it comes to crime, the pen really is mightier than the sword.
Pace of Foreclosures to Pick Up
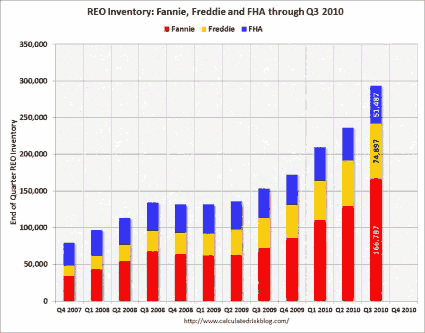
However, with falling home prices it is likely that the pace of foreclosures will pick up again. Even with the slowdown in foreclosures, the number of homes that are now owned by Fannie, Freddie and the FHA is mounting as can be seen in the final graph (although it only goes through the third quarter of 2010). Those institutions have no use for those homes and they will go on the market, often at very aggressive prices, putting downward pressure on the market.
Most of those who are being foreclosed on have indeed fallen far behind in their mortgage payments, and so in that sense the foreclosures are legitimate, even if the paperwork is a mess. The combination of underwater homes and reduced cash flow from one or both of the breadwinners in a family being out of work is a toxic mixture for the health of not just the housing market, but the economy as a whole.
Report Better Than Expectations
In absolute terms, this was a pretty solid report, and it was better than expectations. Still, the huge glut of existing homes on the market, and the shadow inventory of homes that are likely to be foreclosed upon and thus come to market in the near future, means that we really have very little need to build new homes. Thus residential investment — the historical prime locomotive in pulling the economy out of recessions — will stay derailed.
The jobs not created by a rebound in housing construction will mean that household formation will stay depressed, thus further depressing the demand for housing. To put that in more concrete terms, young adults will not be able to get a job and form a family, instead, they will continue living in Mom and Dad’s basement rather than soak up the existing housing inventory. A nasty “chicken and the egg” situation.
USG (USG): Free Stock Analysis Report
Disclaimer: This page contains affiliate links. If you choose to make a purchase after clicking a link, we may receive a commission at no additional cost to you. Thank you for your support!

Leave a Reply