Debt, just beat it!
Hey, even Michael Jackson’s massive income couldn’t overcome his even more massive debts. Unfortunately, his estate will probably do better now that he has passed. That’s because debt is a ferocious animal that eats away at your financial health and causes STRESS and turmoil. Those same symptoms are happening to the entire United States both on a personal and governmental level.
While I’ve harped on governmental debt, this article is about PERSONAL DEBT, the cure for which is SAVINGS.
Savings are needed for real and lasting growth. Growth based solely upon credit/ debt is not lasting as the entire world is finding out – again. It’s not like it’s a lesson that’s new to humanity or anything! Yet, the central bankers desire never ending growth and our bought-and-paid-for politicians gladly oblige… of course we know from listening to the Good Dr. Bartlett, never ending growth quickly leads to exponential growth and a parabolic shaped curve that eventually collapses upon itself.
As the old saw goes, it’s not what you earn, it’s what you don’t spend. Just imagine what Michael Jackson could have accomplished had he used his wealth in a more conservative manner than building and eventually defaulting on his 2,700 acre Neverland Ranch? Ignoring the math of DEBT to INCOME is never a good thing, and far too many people have fallen into that trap. Of course our biggest role model is our own government who spends FAR MORE money than they can ever hope to repay.
The era of leverage (debt) began to quickly accelerate after interest rates peaked and began to fall in 1980. The further interest rates went down, the greater debt became:
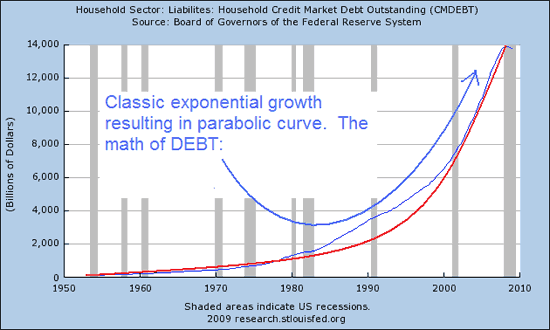
But the Federal Funds rate hit ZERO and now rates have no where to go but up. Thus the era of LEVERAGE is over. The new era will see deleveraging and SAVINGS as the CURE for the debts that ail us. Not that savings at this juncture can overcome the unworkable math, they cannot – all parabolic curves, all bubbles collapse. See the little curl at the top of the household debt chart?
Here’s what that little dip in household debt looks like when expressed in year-over-year (yoy) percent growth:
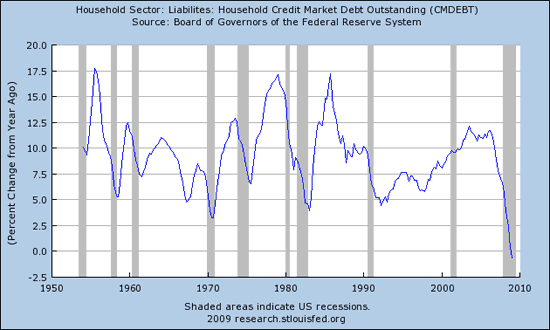
It would appear that never ending growth just came to an end! That’s the largest yoy drop recorded on that chart that goes back to the mid-fifties.
As all those Baby Boomers grew into their peak earning and spending years (Damning Demographics), they pulled their future incomes forward in time via DEBT. They spent that low interest CREDIT MONEY like it was on fire. As they did so, corporate profits followed the same exponential rise, but are now experiencing a parabolic COLLAPSE:
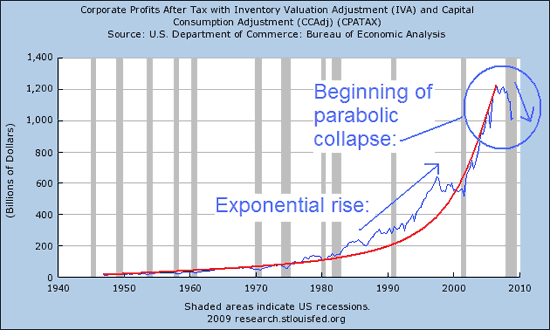
Do you believe the collapse of corporate profits is over? Again, history indicates that parabolic collapses usually return to the base from which the parabolic growth phase began. Where is that on this chart? 1992ish? 1980ish?
Well, it’s a good thing that incomes were also growing in a parabolic manner (just not as quickly as the debt)… but notice the little roll-over at the top of the red income line on the following chart? Note how savings are turning up at the same time incomes are falling? Not good for those who hold debt in a new era of deleveraging:
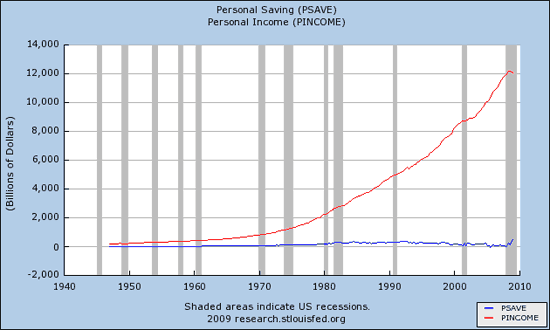
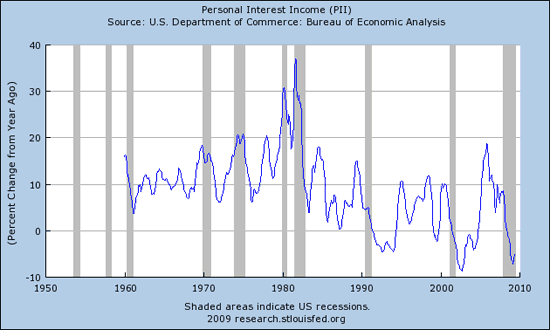
The gap between income and savings is staggering (savings still under 4%). You see, a funny thing happens to those who save when interest rates are falling – they are punished as this chart of Personal Interest Income shows (% change yoy):
Punishing savers is a trend that has likely ended as interest rates can only rise from zero. And this is what happens to personal income from assets in this environment (% change yoy):
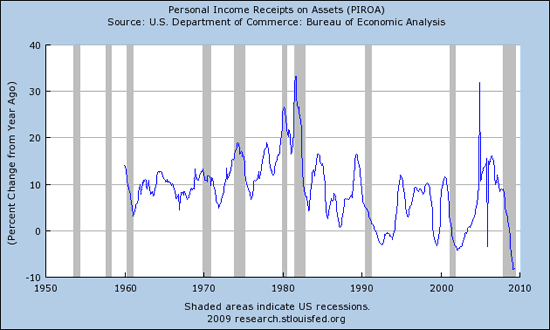
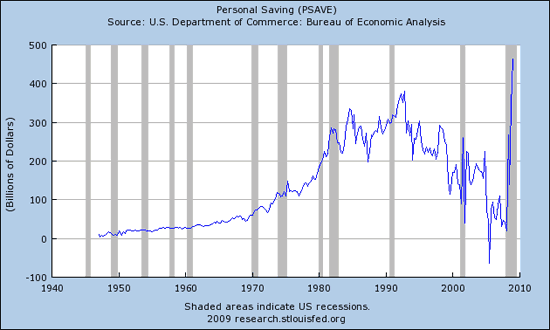
Although earned incomes have grown, investment and savings incomes have fallen. Meanwhile debt just continued to ramp and now that incomes can no longer support the debt, financial institutions are toughening lending standards and the shadow banking system is in disarray. Thus, those who have incomes are forced to delever and to SAVE. Below is the current chart of personal savings showing that we went from a NEGATIVE savings rate to the GREATEST AMOUNT OF SAVINGS IN HISTORY in a very short period of time:
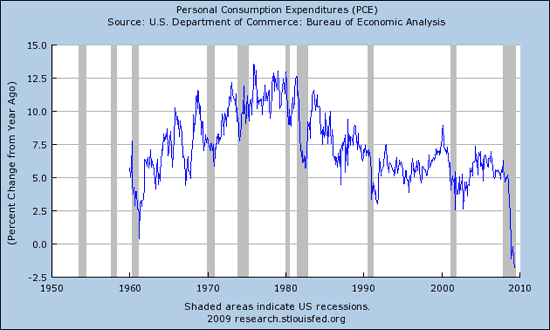
What happens when people save? They are no longer consuming and spending as they were, that’s what! Look at the chart of yoy percent change in Personal Consumption below:
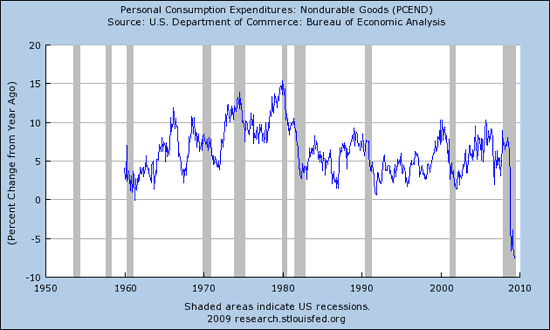
Here’s Personal Expenditures for Non-Durable Goods yoy percent change:
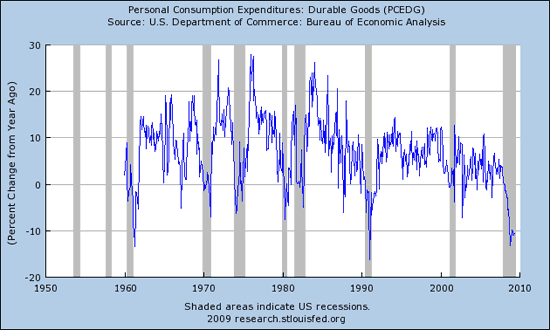
And here’s a chart showing Personal Expenditures for Durable Goods expressed in yoy percent change:
And here’s a chart showing Personal Consumption Expenditures for Services (services represent 70+% of our economy now) – still growing, but not nearly as rapidly. Note the shape and timeframe of that chart!
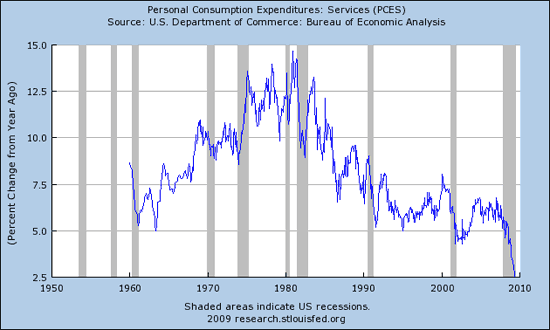
It just happens to peak in 1980 when interest rates peaked… a pivotal year and we have been leveraging our fiat currency ever since.
One of the hallmarks of DEFLATION is when people stop spending and start saving. They use their dollars to pay down debt and to delever. That drives the velocity of money lower and that can create lower asset prices which can become circular creating a deflationary spiral.
If you think that you, personally, can prevent it from happening by being a “good American” and spend everything you have and then some, you are mistaken! Those who delever FIRST delever BEST!
Despite a rising equity market over the past few months, the era of deleveraging is not over – it has only just begun. There is simply no way the math will continue to rise from here. Incomes cannot support never ending growth in debt nor will the government’s income (taxes) be able to keep pace with their debt. No, when it comes to debt, the best course of action is to avoid it.
While I keep showing charts that reveal a sick underlying fundamental picture, you keep hearing talk of greenshoots and see a rising stock market based upon hope and manipulation. Economic Mass Psychosis is a powerful force, but it is NOT as powerful as the collapse of exponential math. The math will express itself fully in time.
Meanwhile, your best course of action is to stay out of Debt… just beat it!
Disclaimer: This page contains affiliate links. If you choose to make a purchase after clicking a link, we may receive a commission at no additional cost to you. Thank you for your support!


Leave a Reply