I’m going to talk about Friday’s GDP report. But first, two questions to test your knowledge of the last ten years of U.S. economic history .
1. According to the official statistics, the share of non-oil goods imports in the U.S. economy is ______ today than it was in 2000.
a. Higher
b. Lower
2. Over the past ten years real GDP has increased 18%, according to the BEA. Over the same period, the real trade deficit in goods, ex imported oil, has increased by how much, according to the official statistics?
a. 5%
b. 18%
c. 30%
Write down your answers, and don’t peek at the data! (you can tell that I’ve been hard at work revising my economics textbook)
Here are the answers.
- According to the official statistics, the correct answer is that non-oil imported goods are a lower share of GDP today (11.1%) than they were in 2000IV (11.4%).
- According to the official statistics, the correct answer is that the real trade gap in goods, ex imported oil, has increased by only 5% since 2000 (measured in absolute terms).
Let me show you the charts, in case you don’t believe me, straight off the latest data from the BEA website. No tricks.
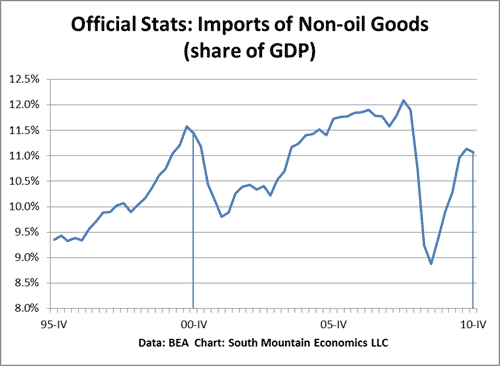
The vertical lines mark off the fourth quarter of 2000 and the fourth quarter of 2010. What’s striking about this chart is how little the share of nonoil imports went up, according to the official stats, even during the boom years. Over the past 10 years, the share of nonoil imports has only averaged 10.9%, lower than it was in 2000.
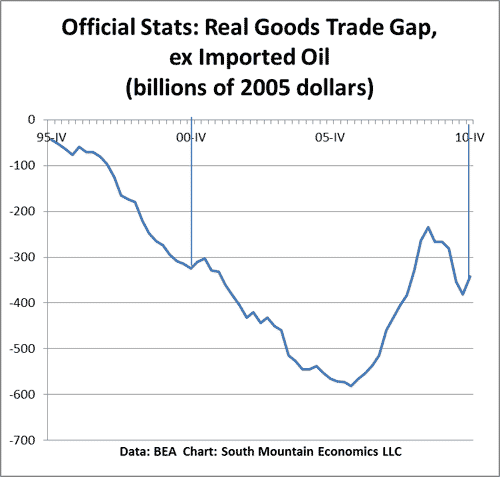
Same thing here. After ten years, we’re roughly at the same place in terms of the nonoil trade gap as we were in 2000, according to the official stats.
Now, if you believe the official statistics, it drives your entire interpretation of the past ten years. If nonoil imports have not grown as a share of GDP, and if the real nonoil trade gap has not widened much, then the 33% decline in manufacturing jobs since 2000 is mainly due to a combination of rising productivity and a short-run domestic demand shortfall. In other words, if you believe the official statistics, we have no competitiveness problem and no trade problem. This is the assumption that drove Obama’s economic policy up to this point (yes, yes, I know there are all sorts of caveats here. But trust me. If you have an economy where the real trade gap is not increasing much and the share of imports is not rising, straightforward calculations give you a small impact from trade).
However, if you accept that the impact of imports on the U.S. economy has increased over the past ten years, then the official GDP stats are by definition missing the boat when it comes to trade. They are underestimating both the nominal impact of growing imports, and the real impact of increasing trade deficits (I’ve written about this many times in the past, but I’m about to write a post that summarizes what we know).
And that brings us to Friday’s GDP report. Please note that out of the 3.2% real GDP growth, 3.44 percentage points came from reports of a shrinking trade gap–a drop in real imports combined with a rise in real exports….and it wasn’t just oil. In fact, the nonoil goods trade gap shrank at a $40 billion annual rate, according to the BEA.
Am I suspicious of this number? Yes. For three reasons. First, given the long-term apparent bias in the GDP stats, I believe that increases in the real trade deficit have been underestimated. That suggests we might be underestimating the increase in the real trade deficit now as well.
Second, do we believe that we had a combination of shrinking imports and a rising consumer spending in the fourth quarter? I quote from the Consumer Metrics Institute:
As mentioned above, the BEA reports a contraction in the quantity of imported goods and services by nearly 4%. While a contraction of this magnitude has occurred quarter-to-quarter many times before, it has generally been accompanied by (and ultimately caused by) a sharp contraction in consumer spending. No such change in consumer behavior is even hinted at elsewhere in the report. The only plausible explanation for this contraction is a huge shift in market share from foreign producers to domestic sources. However, no such shift was observed in any of the larger segments of the consumer economy — including automobiles, apparel, electronics and oil.
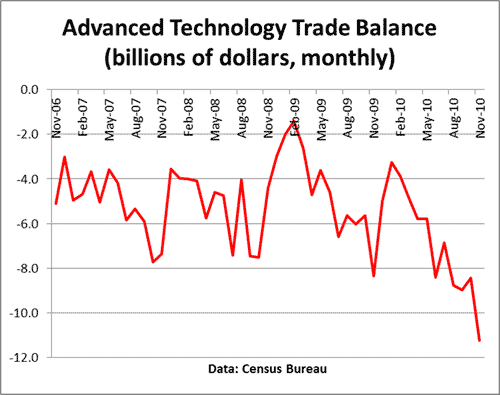
Third, the advanced product trade gap skyrocketed in the first two months of the fourth quarter.
Taken this altogether, I don’t feel comfortable with Friday’s GDP report.
Disclaimer: This page contains affiliate links. If you choose to make a purchase after clicking a link, we may receive a commission at no additional cost to you. Thank you for your support!


Rough times ahead for sure. I like commodity stocks right now, as inflation is sure to ramp up over the next 5 years.