Was the Great Recession of 2007-2009 the result of a large reallocation of workers out of the housing sector after it busted or was it the consequence of a collapse in nominal spending that could have been prevented by policy? Arnold Kling and Bob Murphy have been arguing the former while Scott Sumner and Brad DeLong have been arguing the latter. Here is how Murphy explains the former also known as the “recalculation” view:
[A]fter an unsustainable boom period, the economy needs to “recalculate” and figure out where the excess workers (from the bloated sectors) need to go so that the economy can resume a stable, sustainable growth… Kling (and the Austrians) are arguing that this recession is not simply about a lack of generic “spending” but rather is tied to the preceding housing boom. In particular, during the boom, workers were sucked into construction (and other related occupations). Once the housing bubble collapsed, these excess workers needed to go someplace else. That’s why unemployment started rising, and “the recession” set in.
Scott Sumner responded to this claim by nothing that though this understanding seems reasonable–it was the greatest housing boom after all–it is not supported by the data. The housing boom peaked in early 2006 and yet the Great Recession does not really start to get going until mid-to-late 2008, when policymakers allow aggregate spending to collapse. Thus, the housing bust at best would have led to a mild recession. It was the failure of monetary policy that created the Great Recession.
Murphy replied to Sumner by asking him to consider construction employment. He argued that by plotting construction data along with the unemployment rate one can actually see a recalculation story in the data. His figure, though, was not very convincing as it revealed that the unemployment rate does not start its pronounced climb until about May 2008 whereas construction employment begins its nose dive back in May 2007. Thus, unemployment was relatively stable about a year after construction employment began plummeting. This is more consistent with Sumner’s story.
As is well known, though, the unemployment rate is not always the best measure of labor markets so I decided to look at other relevant employment data. I did so using Sumner’s story that monetary policy effectively tightened in 2008 as a benchmark point. This effective tightening of monetary policy can bee seen by looking at monthly nominal GDP.The idea here is that if the Fed allows total current dollar spending to fall, even passively through say an unchecked decrease in velocity, then monetary policy is effectively tightening. With this understanding, the figure below, indicates that monetary policy effectively tightened in June, 2008 and did not start easing until June 2009. Therefore, monetary policy was tight even before the big blow up on Wall Street in late 2008.
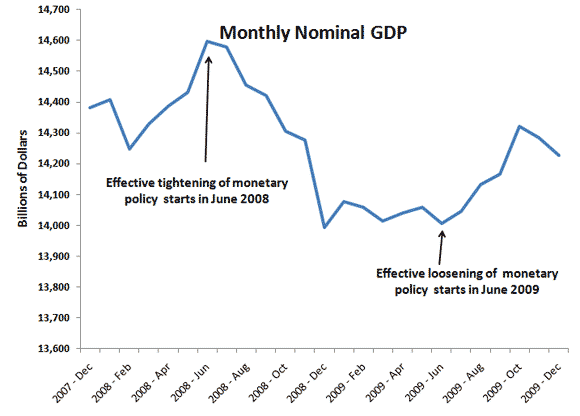
Source: Macroeconomic Advisers
So let’s look at construction employment again prior to the effective tightening of monetary policy in June 2008. And now, let’s compare it to the number of layoffs and discharges measured by the BLS’ Job Opening and Labor Turnover Survey. The figure below shows these two series with the April, 2006 peak in construction employment indicated by the dashed line. Both scales are in thousands.
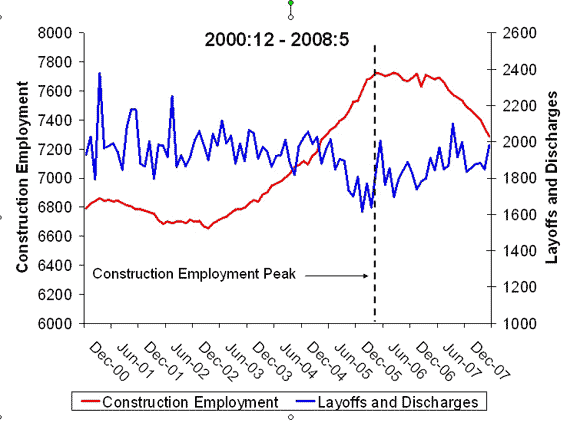
Contrary to the recalculation view, there is no evidence of the peaking and subsequent fall in construction employment making a meaningful increase in the number of layoffs and discharges before June, 2008. The fall in construction employment, therefore, must have been offset by employment growth in other sectors. This interpretation is borne out in the figure below. It shows total employment less construction employment graphed along side construction employment.
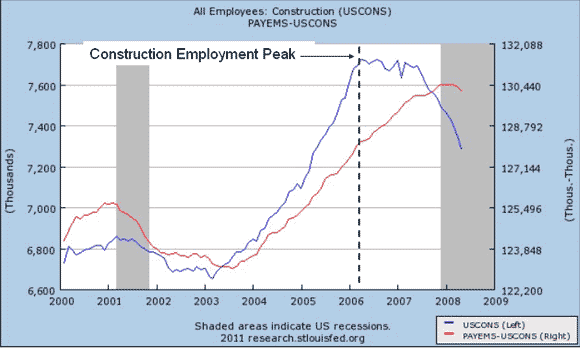
Source: FRED
This figure shows that through April, 2008 non-construction employment in rising (and it only significantly starts declining in June, 2008). This, despite the fact that construction employment had been rapidly dropping from May, 2007 and had stalled out back in April, 2006. In other words, the rest of the economy was doing a decent job absorbing the displaced construction workers for over a year. No reallocation story here. Chalk one up for Scott Sumner.
Scott Sumner’s case, however, gets even stronger if we look beyond mid-2008 and compare it to the growth rate of nominal spending. The figure below shows layoff and discharges again, but now it is graphed against the growth rate of monthly nominal GDP. Now we see there is a surge in layoffs and discharges but it coincides with the collapse in the nominal GDP growth rate.
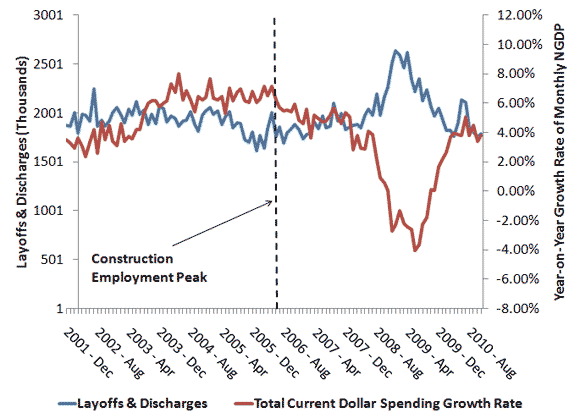
Source: Macroeconomic Advisers, JOLTS
The data seems very clear to me. It indicates there was a housing bust that was putting a damper on economic activity, but by itself was not large enough to create the Great Recession of 2007-2009. Rather, that required the failure of Fed officials to stabilize nominal spending in 2008.
Disclaimer: This page contains affiliate links. If you choose to make a purchase after clicking a link, we may receive a commission at no additional cost to you. Thank you for your support!

Leave a Reply