Let’s begin by taking a look at the big picture Bear Market in terms of percentages. Although we have experienced the largest and fastest 3 month rally in history (42.8%), we are still a long way from even a 38.2% retrace of the bear market which began in October of 2007.
From a time perspective, the average length of time from high to low in the equity markets following a collapse of credit is 2.5 years (typical recessions 1.5 years), this is no typical recession. That average is found by looking at the Great Depression, the collapse of the Nikkei in 1980, and the collapse of our Nasdaq in 2000. Two and a half years from October of 2007 brings us to April 2010, plus or minus. It is my judgment that the fundamental conditions have not improved, but have in fact worsened. The underlying debt has gone largely without default and new debt is being added to the Federal Government like crazy… as in insane (what I call “Economic Mass Psychosis… (EMS – silent P) ” .
Because no REAL solution to the debt problem has been implemented, we are likely to encounter even more severe problems in the future.
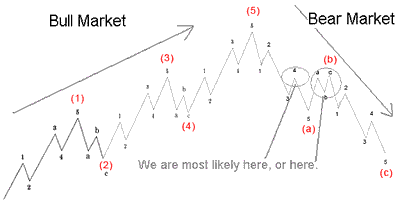
We descended into the 666 SPX low in what many Elliot Wave (EW) experts (like McHugh and Caldaro) are calling the larger Wave A. They believe, and I am not one to argue, that we are currently in wave B up – the eye of the storm.
EW technicians are NOT always right, and if you review my article from this past January entitled, “Wave B… What a Wonderful World!” you will see that they believed at that time that we were in wave B but they now believe that was wave 4 and it was wave 5 that took us into the 666 low. Of course they could be totally wrong about that, it’s still just one possibility. If they are correct and this is wave B up, then wave C down – the devastating leg down – is still to come.
This chart from that article shows a typical bear market in Elliott Wave terms. You can see that I was thinking we were either in wave 4 or wave B – turns out we were probably in 4 and are likely in wave B now:
Of course I’ve been watching the bond market for clues to the future as the flow of capital between bonds and equities can offer us clues as to what the future holds as well. While equities descended in a bear market, money flowed into bonds and drove interest rates down to historic lows as I explained in my recent article Interest Rate Update. Since about Christmas time of last year, however, rates on the long end of the curve have been skyrocketing while the PRICE of bonds have plummeted downwards in a classic exponential growth phase CRASH! TLT (20 year bond fund), for example, has now lost 26.2% of its value since its peak at the end of last year – just a little more than 5 months!
The TNX (ten year fund) is the one that is most closely linked to fixed rate mortgages. In the same timeframe rates on the ten year have nearly doubled! Sooner or later that will have an effect on the holders of debt and on the industries that are dependent upon it. While it’s true that rates are just now returning to historic “normal” levels, those who believe it is indicating health are not considering the fact that debt is further permeating our government and society to never before seen levels. The more debt there is, the harsher the effect of raising rates.
Note in the graph below that the effective funds rate has fallen steadily since 1980 and is now effectively ZERO:
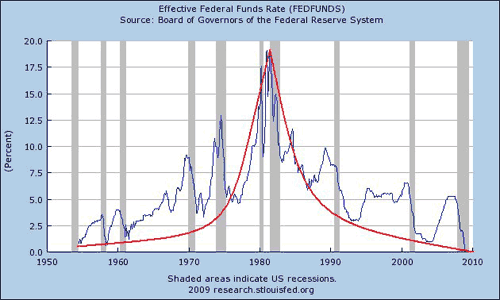
It doesn’t get lower than zero. That leaves only one direction possible on that chart…
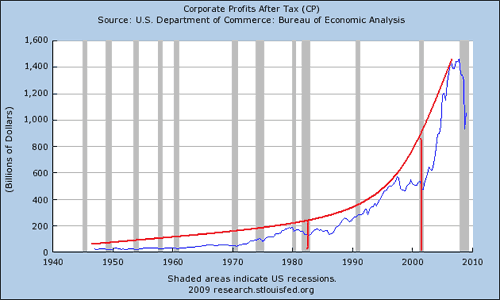
Now let’s examine a chart of corporate profits. Note the accelerated growth that began in about 1980… is there a correlation between interest rates and corporate profits? Is there a correlation between the growth of debt and interest rates AND corporate profits? Of course! This is a classic parabolic growth chart if I’ve ever seen one, it has a similar shape and timeframe as the rate of growth in debt. You can see the three phases, slow growth, fast growth, and exponential growth that turns into a parabolic blow off followed by parabolic collapse. Almost ALL parabolic collapses return to their base at a minimum:
I’m certainly not the only one who is noticing the correlation of rates to profits, Martin Weiss has as well (Market Schizophrenia and the Madness of Crowds).
Schizophrenia indeed! I’m usually more polite and just call it Economic Mass Psychosis!
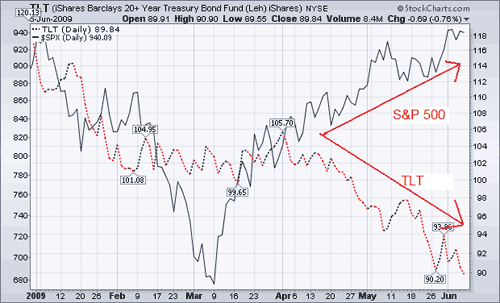
Here’s a chart showing TLT (20 year bond PRICE) in red/black versus the S&P 500 in black. Notice the HUGE divergence over the past few months as Martin points out:
There are other divergences in the market now as well. This rally is definitely long in the tooth and while it may need to go up and reach the 38.2% retrace level, it certainly doesn’t have to. But hey, the people hear the hysteria of rising prices on CNBS and can’t help but be drawn into the hype and the HOPE – that would be wave B – Everybody has a dream…
Disclaimer: This page contains affiliate links. If you choose to make a purchase after clicking a link, we may receive a commission at no additional cost to you. Thank you for your support!


Leave a Reply