Often after a sharp economic downturn we observe an equally dramatic recovery. But nobody can claim to be seeing that so far in the currently available data.
Since the beginning of April, we’ve been discussing one potentially favorable indicator in the form of new claims for unemployment insurance. In each of the last 6 recessions, the 4-week average of this series reached a peak less than 8 weeks before the economic recovery began. None of the readings over the last 8 weeks exceeded the value reached April 9, consistent with the hypothesis that we are past the peak in new claims for this cycle.
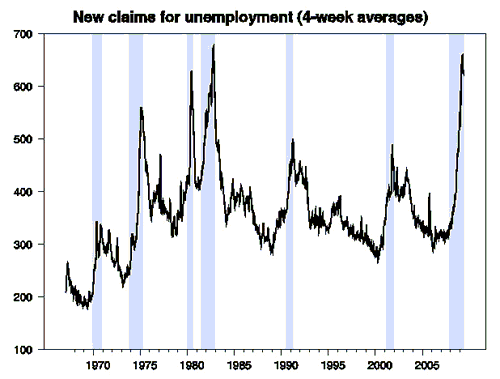
Black line: 4-week average of seasonally adjusted weekly initial claims for unemployment insurance, from Department of Labor via Webstract. Shaded areas correspond to recessions as judged by the National Bureau of Economic Research.
On the other hand, the most recent values for initial unemployment claims have not shown further improvements. Although the number released on Thursday was widely reported in the press as a drop in the number of new claims, it actually resulted in a slight increase in the 4-week average, putting the latter pretty much back where it was 4 weeks ago. If we were really beginning a recovery similar to that experienced in previous episodes, we should be seeing sharper drops in this number at this point.
Detailed behavior of seasonally adjusted weekly new claims for unemployment insurance (black line) and 4-week average (blue line) associated with historical peaks and most recent episode. Vertical lines in first five episodes denote the first week of the first month following the business cycle trough as designated by the NBER.
And if an economic recovery had begun at this point, we should be seeing confirmation in a number of other indicators. The downturn in business fixed investment gained momentum late in this cycle, leading me to expect the recovery to begin with growth in personal consumption and housing.
Average cumulative change in 100 times the natural log of real GDP or its respective component beginning from the business cycle peak for the 10 recessions between 1947 and 2001. Horizontal axis denotes quarters after the peak.
One indicator I’m watching in particular is new car sales, since current sales are unsustainably low given scrappage of old vehicles. But I see little sunshine in the May auto sales numbers. Total light vehicles sold in the U.S. had been down 34% between April 2008 and April 2009, and were down that same 34% between May 2008 and May 2009.
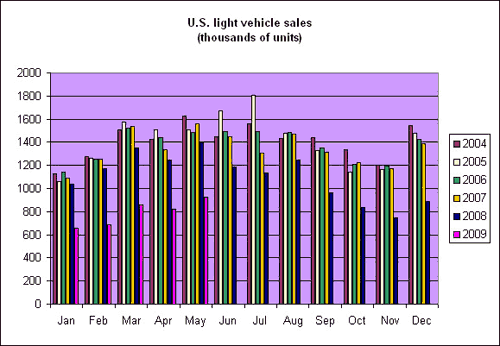
Light vehicles sold in the United States. Data source: Wardsauto.com
We did now get two consecutive monthly increases in disposable personal income, and that’s certainly good news. But it’s interesting and important that real personal consumption expenditures actually fell across those months, leaving some doubt about whether PCE growth will make a positive contribution to the 2009:Q2 GDP numbers.
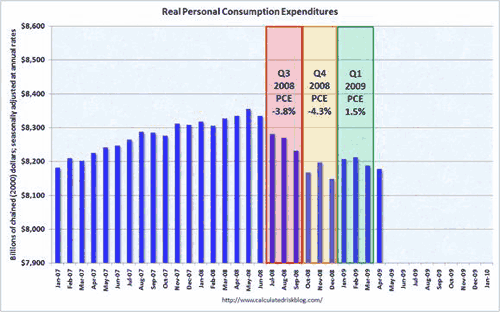
Source: Calculated Risk.
Consumer sentiment has lifted, but has not apparently brought spending up with it.
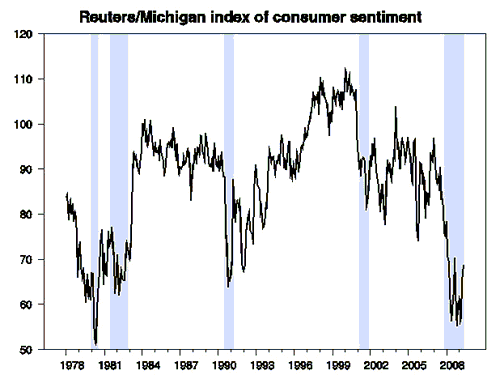
Reuters/Michigan index of consumer sentiment. Data source: FRED and MarketWatch.
The reason for that, I believe, is that the recent consumption slowdown is not an “animal spirits” kind of move, but instead is at least in part a response to a previous profound imbalance in the ratio of household debt to GDP. Capital markets were seriously malfunctioning over 2004-2006, with many loans made that we can see today were in the interests of neither borrowers nor lenders. Deleveraging is going to be an unavoidable part of the correction process, no matter how consumers feel.
Household debt as a fraction of GDP. Data source: Federal Reserve Board Flow of Funds, Table L2.
The drop in oil prices since last summer was certainly helpful for that goal of strengthening household finances. But that also makes the significant move in oil prices back up since December a troubling development.
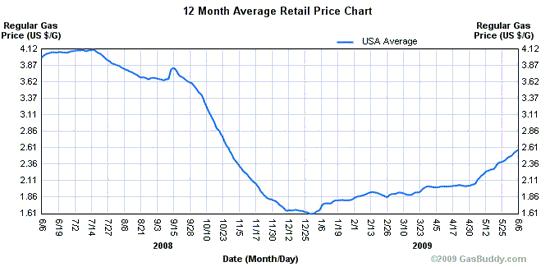
National average U.S. gasoline retail price. Source: NewJerseyGasPrices.com.
The 16% increase in gasoline prices between December and February resulted in an additional $37 billion spending by consumers at an annual rate on gasoline and fuel oil, increasing the share of energy purchases in consumer budgets from 4.85% in December to 5.17% in February. The additional 40% increase we’ve seen in the retail price of gasoline since February has likely brought that expenditure share back up above 6%.
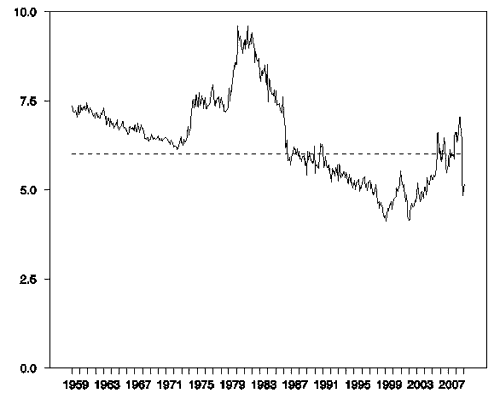
Energy expenditures as a fraction of consumer spending. Calculated as 100 times nominal monthly consumption expenditures on energy goods and services divided by total personal consumption expenditures. Data source: BEA Table 2.3.5U, Personal Consumption Expenditures by Major Type of Product and Expenditure, obtained from Econstats. Dashed line is drawn at 6.0%.
A robust recovery? How and where?
Disclaimer: This page contains affiliate links. If you choose to make a purchase after clicking a link, we may receive a commission at no additional cost to you. Thank you for your support!


Leave a Reply