The rise in unemployment and a falling number of job openings kept unemployment rates at elevated levels during the month of April in all 372 metropolitan areas. The national unemployment rate hit 8.6% in April, not seasonally adjusted, up from 4.8% a year earlier, with 93 metropolitan areas reporting jobless rates of at least 10% compared to only 7 metropolitan areas in April 2008.
According to the Bureau of Labor Statistics [BLS], on a Y/Y basis (from April ’08 – April ’09), nonfarm employment fell in 37 of the 38 metropolitan areas with annual average employment levels above 750,000 in fiscal ’08.
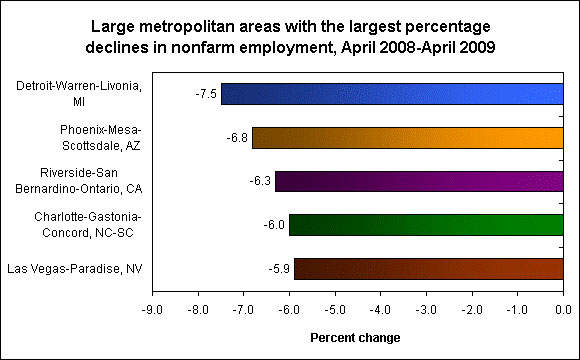
The following chart, courtesy of BLS, shows the largest over-the-year percentage decline in employment in these large areas was recorded in Detroit-Warren-Livonia, Michigan (-7.5%). The next largest declines were in Phoenix-Mesa-Scottsdale, Ariz. (-6.8%), Riverside-San Bernardino-Ontario, Calif. (-6.3%), Charlotte-Gastonia-Concord, N.C.-S.C. (-6.0%), and Las Vegas-Paradise, Nevada (-5.9%). Five additional large areas recorded rate increases of 5% or more.
Graph: BLS
Disclaimer: This page contains affiliate links. If you choose to make a purchase after clicking a link, we may receive a commission at no additional cost to you. Thank you for your support!
Leave a Reply