In today’s NYT, Casey Mulligan presents an interesting picture of GDP during the “1980-82 recession” — the conjoining of the two NBER defined recessions in 1980 and 1981-82. Based on the comparison with the current recession, he concludes:
While the job losses, foreclosures, stock declines and other casualties of the current recession have been very painful, substantially more bad economic news is needed to make this recession worse than the downturns of 1980-’82, at least in G.D.P. terms.
Here is Professor Mulligan’s graph.
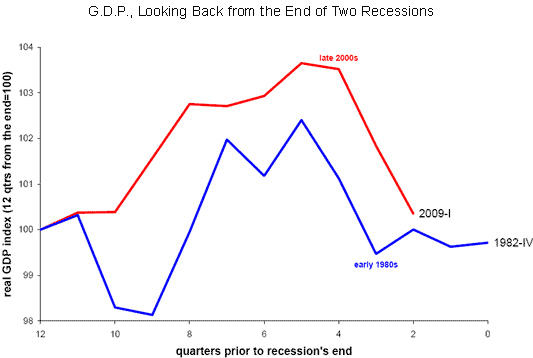
Figure from C. Mulligan, “Worse than 1982?” Economix (June 3, 2009).
Here, without comment, are three graphs of employment and industrial production, but normalizing the start date instead of the end date. Why one would want to normalize on the trough especially when the trough date is unknown, I’m not certain, but there’s nothing to stop one from doing so. But, as I say, I’ll normalize on the start date in the graphs below.
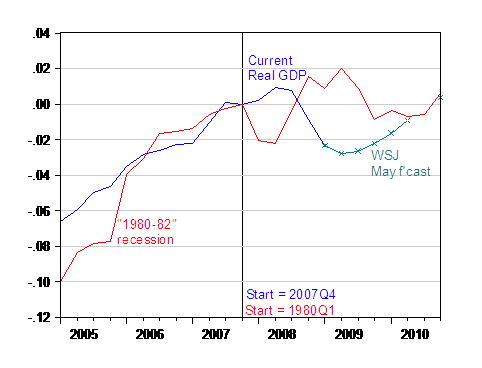
Figure 1: Log real GDP normalized on 2007Q4 (blue), May WSJ mean survey forecast (teal x), log real GDP from “1980-82 recession” normalized on 1980Q1 (red). Source: BEA, preliminary 2009Q1 release, WSJ May survey, NBER and author’s calculations.
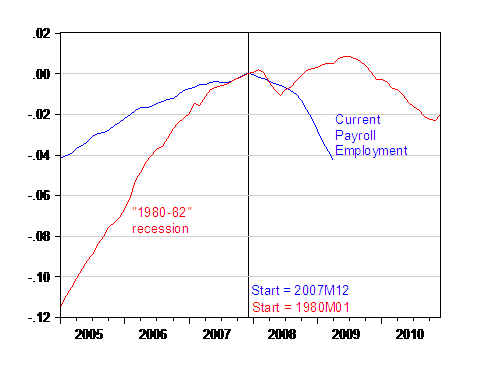
Figure 2: Log nonfarm payroll employment normalized on 2007M12(blue), log NFP from “1980-82 recession” normalized on 1980M01 (red). Source: BLS via FREDII, NBER and author’s calculations.
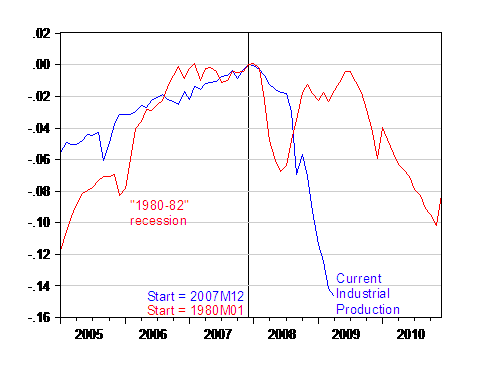
Figure 3: Log industrial production normalized on 2007M12(blue), log NFP from “1980-82 recession” normalized on 1980M01 (red). Source: Federal Reserve via FREDII, NBER and author’s calculations.
One observation, regarding data revisions. NBER doesn’t place central import to GDP, in part because GDP is subject to sometimes substantial revisions that alter not only the level, but contour of GDP. This is important to the extent that Professor Mulligan’s graph (and my Figure 1) compare preliminary 2009Q1 data to final (and repeatedly revised) GDP figures. I suspect (although have no independent validation) that recent GDP figures will probably be revised downward. In this latest episode, I also wonder about the large contributions to overall GDP growth coming from the finance sector (think about how easy it is to calculate real value added in that sector), when the “F” in FIRE accounts for something like 5% of GDP (see an interesting article by Ed Leamer here).
Output, Employment and Industrial Production in the “1980-82 Recession”
Disclaimer: This page contains affiliate links. If you choose to make a purchase after clicking a link, we may receive a commission at no additional cost to you. Thank you for your support!

Leave a Reply