Ryan Avent is sounding a lot like Scott Sumner:
I like to point out that in June of 2008 the Federal Reserve forecast real GDP growth in 2009 of 2.0% to 2.8%, when in fact the economy shrank in 2009 by over 2%. Of course, this doesn’t mean that central banks have no basis on which to make policy. All they need do is look at the evidence in front of them… In late 2008, the Fed might have taken comfort from its forecasts. Had it been looking at market signals—falling equity and commodity prices, a rising dollar, and movements in bond yields—the need for aggressive monetary easing would have seemed clear.
In other words, beginning around mid-2008 the Fed passively allowed market conditions to deteriorate and did so all the way up to the financial blow-up in September. The Fed’s actions during this time were not enough to stem the growing demand for liquidity. The Fed, therefore, was effectively tightening monetary policy by failing to accommodate this growth in money demand. This passive tightening by the Fed prior to the crisis can be seen below:
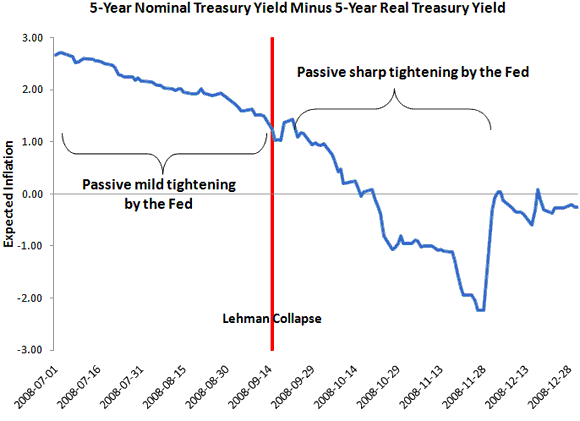
This figure shows the spread between the nominal and real yield on 5-year treasuries. It fell about 170 basis points during the period leading up to the collapse of Lehman in September. Normally, this spread is interpreted as the expected inflation rate. In this case, it shows a decline in inflation expectations that in turn suggests a deterioration in expected aggregate spending (assuming no big increases in expected productivity). It is likely that this spread was also reflecting a heightened liquidity premium during this time. Here, the implication is the same. A heightened liquidity premium indicates increased demand for highly liquid assets like treasuries and money that, in turn, also imply less aggregate spending. Both interpretations point to the Fed allowing monetary policy to passively tighten during this time. This passive tightening was unfortunate and most likely contributed to the severity of the financial crisis. That being said, it pales in comparison to the passive tightening of monetary policy that occurred after the Lehman collapse. Thus, I have classified the July-September period in the figure as the passive mild tightening of monetary policy and the September-December period as the passive sharp tightening of monetary policy.
Disclaimer: This page contains affiliate links. If you choose to make a purchase after clicking a link, we may receive a commission at no additional cost to you. Thank you for your support!

Leave a Reply