This column provides evidence on economic performance in the decade after a macroeconomic crisis. It finds that growth is much slower and as well as several episodes of “double dips”. It adds that many of these economies experience plain “bad luck” that strikes at a time when the economy remains highly vulnerable.
“The process of contraction, like the process of expansion, is cumulative and self-reinforcing. Once started, no matter how, there is a tendency for it to go on, even if the force by which it was provoked has in the meantime ceased to operate.”–Gottfried Haberler, Prosperity and Depression, 1937
In our recent paper (Reinhart and Reinhart 2010), we examine the behaviour of real GDP (levels and growth rates), unemployment, inflation, bank credit, and real estate prices in a twenty-one-year window surrounding selected adverse global and country-specific shocks or events. This note summarises some of our main findings.
Chief among these is that economic growth is notably slower in the decade following a macroeconomic disruption. We extend our results to provide evidence of several post-crisis “double dips” in the years following a crisis. Indeed, a faltering of economic recovery is not uncommon after a severe financial shock – although this can often be ascribed to exogenous events.
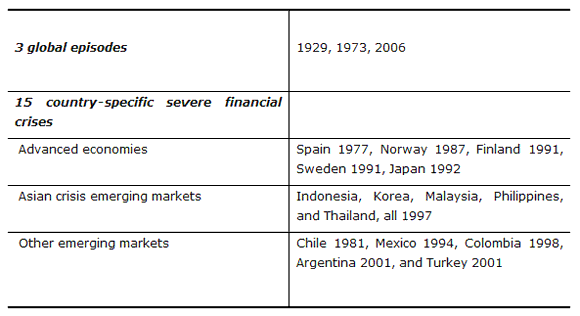
We study the 1929 stock market crash, the 1973 oil shock, the 2007 US subprime collapse, as well as fifteen severe post-World War II financial crises. We have chosen not to look at the immediate antecedents and aftermath of these events and instead focus on longer horizons that compare decades rather than years.
Methodology preamble
Our statistical analysis, which is described in more detail in the paper, is based on nonparametric comparisons of the data that are applied to the episodes listed in Table 1. Simply put, we examine if key macroeconomic indicators seem to come from the same distribution before and after a dislocating event. The exact time periods of the before-and-after windows vary across our exercises, but we usually try to employ the longest possible spans of comparison.
Table 1. Episodes and coverage
Growth, GDP levels, and unemployment
Real per capita GDP growth rates are significantly lower during the decade following severe financial crises and the synchronous world-wide shocks. The median post-financial crisis GDP growth decline in advanced economies, as shown in Figure 1, is about 1%.
During the first three years following the 2007 US subprime crisis (2008-2010), median real per capita GDP income levels for all the advanced economies is about 2% lower than it was in 2007. This is comparable to the median output declines in the first three years after the fifteen severe post World War II financial crises. However, while 82% of the observations for per capita GDP during 2008 to 2010 remain below or equal to the 2007 income level, the comparable figure for the fifteen crises episodes is 60%. This indicates that during the current crisis, recessions have been deeper, more persistent, and widespread.
Figure 1. Real per capita GDP growth in the decade before and the decade after severe financial crises: Post-WWII, advanced economies
Probability density function
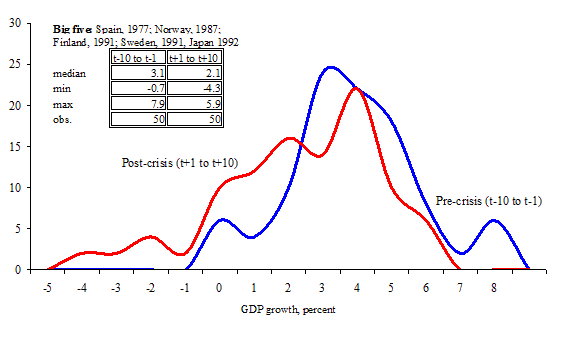
Sources: Reinhart and Reinhart (2010) and sources cited therein.
In the ten-year window following severe financial crises, unemployment rates are significantly higher than in the decade that preceded the crisis. The rise in unemployment is most marked for the five advanced economies, where the median unemployment rate is about 5 percentage points higher (Figure 2). In ten of the fifteen post-crisis episodes, unemployment has never fallen back to its pre-crisis level, not in the decade that followed nor through end-2009.
Figure 2. Unemployment rate in the decade before and the decade after severe financial crises: Post-WWII, advanced and Asian economies
Probability density function, five advanced economies
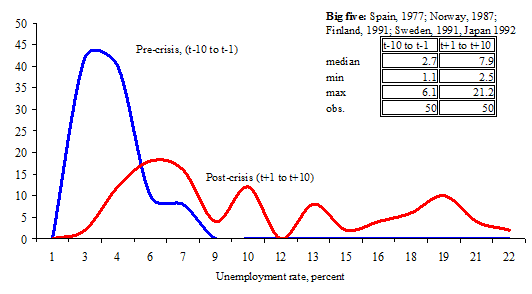
Sources: Reinhart and Reinhart (2010) and sources cited therein.
Housing and credit
Real housing prices for the full period is available for ten of the fifteen financial crisis episodes. For this group, over an eleven-year period (encompassing the crisis year and the decade that followed), about 90% of the observations show real house prices below their level the year before the crisis. Median housing prices are 15% to 20% lower in this eleven-year window, with cumulative declines as large as 55%. The observations on unemployment and house prices, of course, may be related, as a protracted slump in construction activity that accompanies depressed housing prices may help to explain persistently higher unemployment.
Figure 3. Real house prices before and ten years after severe financial crises: Ten post-WWII episodes
Probability density function: Advanced economies
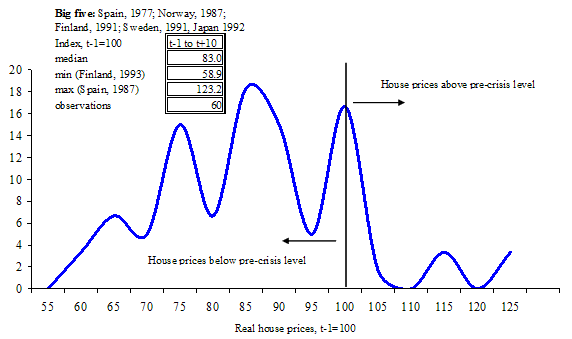
Sources: Reinhart and Reinhart (2010) and sources cited therein.
Another important driver of the cycle is the leverage of the private sector. In the decade prior to a crisis, domestic credit/GDP climbs about 38% and external indebtedness soars. Credit/GDP declines by an amount comparable to the surge (38%) after the crisis. However, deleveraging is often delayed and is a lengthy process lasting about seven years. The decade that preceded the onset of the 2007 crisis fits the historic pattern. If deleveraging of private debt follows the tracks of previous crises as well, credit restraint will damp employment and growth for some time to come.
Double dips and external shocks
The media is filled with concerns about a “double dip,” or that the economic recovery will stall out after only a few quarters of growth. Our analysis is based on annual data, so brief spurts of growth bracketed by output declines might be smoothed away in yearly observations. But a more general pattern, often applied to Japan’s experience in the late 1990s (which actually stretches the window to encompass the 5th and 6th year after the crisis), is documented in Table 2. Of the 15 post World War II episodes examined, nearly one half of these (seven episodes) involved a broadly-defined double dip.
As shown in Table 2, growth rates often became negative once more after the crisis. The magnitude of the slowdown (measured as the highest post-crisis growth rate less the lowest recorded subsequently) also provides a sense of the loss of momentum. These post-crisis downturns help explain why growth rates are significantly lower and unemployment rates higher in the decade after the crisis and why these results are not driven by weak economic performance that is common in the vicinity of the crisis.
Concluding observations
In our recent paper we document in the private sector what Reinhart and Rogoff (2009) document in the public sector, namely that that the years following severe financial crises are characterised by high levels of debt and leveraging. This observation is essential in understanding why these financially frail economies are particularly vulnerable to adverse shocks, whether or not they emanate from the demand and supply factors discussed in our paper. A drag on spending might owe to mistakes in domestic policies or hysteresis effects of the crisis. But the list of event in Table 2 suggests that there is an important role for plain “bad luck,” originating in exogenous events or external developments that strike at a time when the economy remains highly vulnerable.
Table 2. Episodes of a marked slowdown or recession in 3rd or 4th year after the crisis
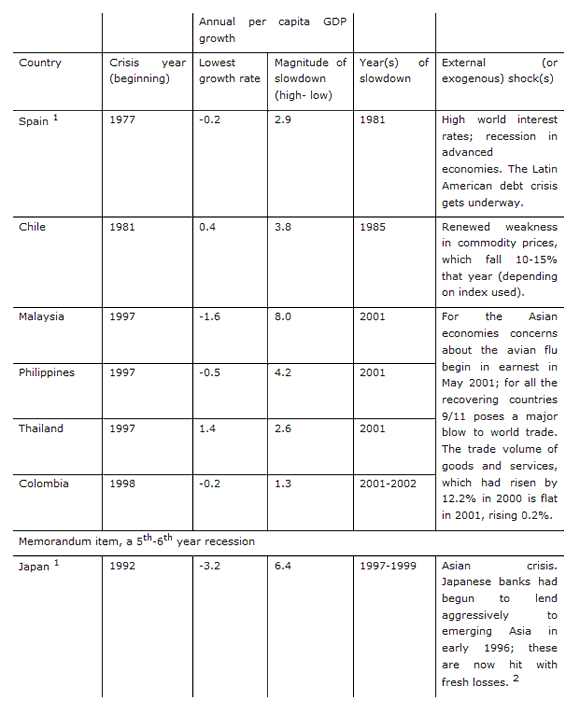
¹ It is important to note that, unlike the other 13 financial crises in our sample Spain 1977 and Japan 1992 “escaped” an initial recession at the time of crisis.
² See Kaminsky and Reinhart (2000) for an analysis of the patterns of bank lending during the Asian crisis.
Reinhart and Reinhart (2010) was prepared for the Federal Reserve Bank of Kansas City Jackson Hole Symposium, Macroeconomic Challenges: The Decade Ahead, August 26-28, 2010
References
•Kaminsky, Graciela L and Carmen M Reinhart (2001), “Bank Lending and Contagion: Evidence From the Asian Crisis”, in Takatoshi Ito and Anne Krueger (eds.), Regional and Global Capital Flows: Macroeconomic Causes and Consequences, University of Chicago Press for the NBER:73-99.
•Reinhart, Carmen M and Vincent R Reinhart (2010), “After the Fall”, NBER Working Paper 16334, forthcoming in Federal Reserve Bank of Kansas City Economic Policy Symposium Volume, Macroeconomic Challenges: The Decade Ahead at Jackson Hole, Wyoming, on August 26-28, 2010.
•Reinhart, Carmen M and Kenneth S Rogoff (2009), This Time is Different: Eight Centuries of Financial Folly, Princeton Press.
![]()
Disclaimer: This page contains affiliate links. If you choose to make a purchase after clicking a link, we may receive a commission at no additional cost to you. Thank you for your support!

Leave a Reply