The Trade Deficit fell in July to $42.78 billion, down from $49.76 billion in June. This is very good news for the economy…but not good enough. The trade deficit was also substantially smaller than the $47.3 billion consensus expectation. While it was a major month-to-month improvement, on a year-over-year basis the total trade deficit was up 29.3% from $33.09 billion a year ago.
The trade balance has two major parts: trade in goods and trade in services. America’s problem is always on the goods side; we actually routinely have a small surplus in services. Relative to June, the goods deficit fell to $55.23 billion from $62.22 billion in June, a decline of 11.2%. Relative to a year ago, the deficit was up 26.4% from $43.75 billion. The service surplus was unchanged from June at $12.46 billion, but up 16.9% from last years’ $10.66 billion. Exports of goods rose by $2.79 billion or 2.7% to $107.68. Relative to a year ago, goods exports are up 16.4%.
In other words, we are easily on pace to meet Obama’s goal of doubling exports of goods over the next five years. Service exports, on the other hand, were essentially flat for the month but up 10.3% year over year, which is well short of the pace needed to double over five years.
A Big Deal?
Doubling exports over five years is all well and good, but not if we also double our imports over the same time-frame. After all, it is net exports which are important to GDP growth, and to employment. The monthly numbers were very encouraging in this regard, as goods imports fell by $4.2 billion, or 2.5%, to $162.12 billion.
That, however, is just relative to the disastrous trade numbers we had in June. Relative to a year ago, goods imports are up $30.94 billion or 23.4%. At that pace, they would be up 186.6% over five years, while goods exports would be up just 113.9%, and are starting from a much higher base. Thus the goods trade deficit would be much higher five years from now than it is today.
Put another way, in July we bought from abroad $1.51 worth of stuff for every dollar of stuff we sold. That was a nice improvement from the $1.59 worth of stuff in June, but slightly worse than the $1.50 worth of stuff a year ago. On the service side, both imports and exports were almost unchanged from June. Relative to a year ago, service exports are up 10.3%, while service imports are up 10.1%.
All things being equal, it is better to see trade going up than down. We want to see both exports and imports growing, but given the massive deficit we are running, we need to have exports rise dramatically faster than imports, or actually see imports fall.
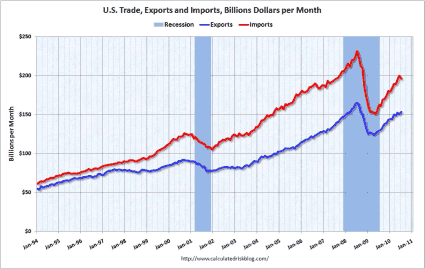
A big part of what made the Great Recession into a global downturn was the absolute collapse in global trade. This can clearly be seen in the long-term graph of our imports and exports below (from http://www.calculatedriskblog.com/).
Falling imports and exports are clearly associated with recessions. In the Great Recession, our imports collapsed faster than our exports, and so we had a very big improvement in the trade deficit. That was just about the only thing keeping the economy on life support during those dark days. For example, in the first quarter of 2009 the smaller trade deficit increased growth by 2.64%. If not for that, the economy would have shrunk by 9.0% instead of by 6.4%. Thus, growing world trade is a good thing, but not if it comes at the expense of an ever-rising U.S. trade deficit.
More Problematic Than the Budget Deficit
The trade deficit is a far more serious economic problem — particularly in the short to medium term — than is the budget deficit. In the second quarter, the increase in the trade deficit subtracted a full 3.37 points from the economic growth rate. If we had somehow managed to keep the trade deficit at the same level as in the first quarter, then second quarter growth would have been 5.0%, not 1.6%.
The trade deficit is directly responsible for the increase in the country’s indebtedness to the rest of the world, not the budget deficit. That is not just a matter of opinion, that is an accounting identity.
Think about it this way: during WWII the federal government ran budget deficits that were FAR larger as a percentage of GDP than we are running today, but we emerged from the war the biggest net creditor to the rest of the world that the world had ever seen up to that point. Then, the federal government owed a lot of money, but it owed it to U.S. citizens — not to foreign governments.
Slowly but surely, the trade deficit is bankrupting the country. While most of the foreign debt is in T-notes, try thinking of it as if we were selling off companies instead of T-notes. This month’s trade deficit is the equivalent of the country selling off Ford (F), while last month’s deficit was the equivalent of selling off Home Depot (HD). How long would it take before every major company in the U.S. was in foreign hands if this keeps up?
The Two Major Parts
The goods deficit has two major parts, that which is due to our oil addiction and that which is due to all the stuff that lines the shelves of Wal-Mart (WMT). Of the total goods deficit of $55.23 billion, $20.91 billion — 37.9% — is due to our oil addition.
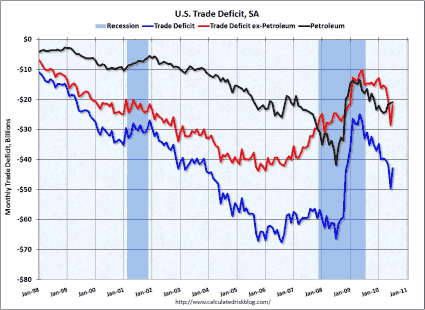
The second graph (also from http://www.calculatedriskblog.com) breaks down the deficit into its oil and non-oil parts over time. It shows that the overall trade deficit (blue line) deteriorated sharply from 1998 to mid-2005, and then remained at just plain awful levels until the financial meltdown caused world trade to come to a screeching halt. That caused a major — but unfortunately short-lived — improvement in the overall deficit.
The stabilization in the non-oil deficit started about two years earlier, but that was offset by the effects of soaring oil prices which caused the oil side of the deficit to deteriorate sharply. The monthly improvement in the overall deficit in July was mostly due to the non-oil side, where the deficit fell to $33.20 billion from 39.73 billion in June. That is an improvement of $6.53 billion, or 16.4%. In contrast, the oil deficit fell only slightly from $21.30 billion to $20.91 billion, a 1.8% improvement. Relative to a year ago, the non-oil side of the deficit rose by 31.2% while the oil side rose by 16.6%.
Still, the oil side should be the low-hanging fruit to bring down the overall trade deficit and thus help spur economic growth. Oil is primarily used as a transportation fuel. The technology exists and is widely used abroad for natural gas to power cars and trucks. Thanks to the emerging shale plays, we have ample domestic supplies of natural gas, and on a per BTU basis, natural gas is selling for the equivalent of oil at $22.44 per barrel.
We need to get past the “chicken and the egg” problem of nobody wanting to buy a natural gas-powered vehicle because there are no convenient places to refuel, and gas stations’ reluctance to install refueling stations for natural gas-powered vehicles since there are not many of them on the road. Not only would such a move save money for drivers in the long run (there is an upfront capital cost as natural gas-powered engines are more expensive than regular gasoline powered engines), but it would substantially reduce our trade deficit.
Natural gas is also a much cleaner fuel and emits far less CO2 than does gasoline. Thus it would be a very useful step towards stopping global warming. Doing this, especially breaking the chicken and the egg problem, will take federal government leadership. The benefits for the economy, however, would be huge. It seems inevitable to me that it will eventually happen, and when it does, it will be a great boon to major natural gas producers like Chesapeake (CHK) and EnCana (ECA). The timing of it happening is very uncertain, but the sooner it happens, the better.
The best thing that could happen to help on the non-oil side of the trade deficit would be for the dollar to fall. A weak dollar not only makes imports cheaper, it makes our exports more attractive. It is not just a direct effect of say our being able to sell more goods in Japan because the dollar is weak relative to the yen, but U.S. companies are often in direct competition with Japanese or European companies in selling to third countries.
The recent weakness in the Euro relative to the dollar is a big part of the reason that Germany’s exports have been booming to China. For example, both General Electric (GE) and Siemens (SI) make MRI machines for hospitals. Assuming that they were of roughly equal quality, then when the Euro drops sharply against the dollar, Siemens is going to be able to undercut GE for export orders to China.
By country, we ran some small trade surpluses with Hong Kong, Singapore and Australia, but we continue to run large deficits with most of our other trading partners. The biggest deficit by far is with China, the source of many of the goods on the shelves of Wal-Mart. There, the trade deficit declined slightly for the month, falling to $25.9 billion from $26.2 billion. Still that is 46.9% of our overall trade deficit.
While China has agreed to let the Yuan appreciate, so far it has done so at only a glacial pace. Our deficit with the European Union expanded sharply this month rising to $9.9 billion from $7.8 billion. That was offset by declines in our bilateral trade deficits with OPEC ($8.0 billion vs. $8.9 billion), Mexico ($$5.3 billion vs. $6.2 billion) and Canada ($1.4 billion vs. $2.5 billion).
In Summation
Overall, this was a very positive report. However, the trade deficit is still bigger than it was in May ($41.79 billion). So this was more just a reversal of a disaster in June than the start of a real improvement in the situation.
Getting the trade deficit under control needs to be a top economic priority. It will help raise overall economic growth and with it, employment. With the rise in employment will come higher tax revenues, which will help bring the budget deficit under control. To do that we need to do two things: first get our oil addiction under control. The second is that “King Dollar” needs to meet the same fate as Charles I and Czar Nicholas.
FORD MOTOR CO (F): Free Stock Analysis Report
WAL-MART STORES (WMT): Free Stock Analysis Report
Disclaimer: This page contains affiliate links. If you choose to make a purchase after clicking a link, we may receive a commission at no additional cost to you. Thank you for your support!

Leave a Reply