(With apologies to Mussorgsky.) Here’s the first:
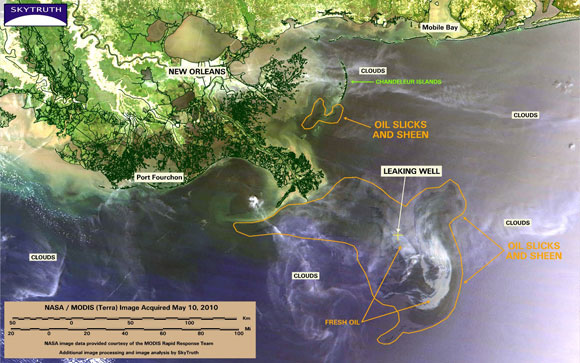
Figure 1: MODIS/Terra image/Sky Truth, May 10, 2010.
The more worrisome picture is below. It depicts the cumulative spill, using the initial estimate, and the more recent estimates based on analyses of the footage of the leaks.
Figure 2: Estimated cumulative oil spill, according to NOAA (blue line), according to Wereley (red line), with plus/minus 20% bands (gray lines), Exxon Valdez spill (black line), and Ixtoc-1 spill (black line), all in thousands of barrels. Wereley estimate is from Steven Wereley/Purdue University. Source: Harris, “Gulf Spill May Far Exceed Official Estimates,” NPR, May 14, 2010.
The implications of the higher rates are obvious, but to be explicit, here are some threshold dates. Under the original estimate, the Exxon Valdez spill at 250,000 barrels is exceeded on 6/8; under the Wereley midpoint estimate, it was exceeded between 4/22 and 4/23.
The biggest Gulf of Mexico event, the 1979 Ixtoc-1 spill (3.5 million barrels), will be exceeded on 6/8 using Wereley estimates. Eugene Chiang (Berkeley) provides an estimate between 20 thousand and 100 thousand barrels per day; the high estimate implies the Ixtoc-1 threshold will be breached within about a week — on 5/24.
The implications of these differing estimates are potentially enormous. From NYT:
“There’s a shocking amount of oil in the deep water, relative to what you see in the surface water,” said Samantha Joye, a researcher at the University of Georgia who is involved in one of the first scientific missions to gather details about what is happening in the gulf. “There’s a tremendous amount of oil in multiple layers, three or four or five layers deep in the water column.”
The plumes are depleting the oxygen dissolved in the gulf, worrying scientists, who fear that the oxygen level could eventually fall so low as to kill off much of the sea life near the plumes.
Dr. Joye said the oxygen had already dropped 30 percent near some of the plumes in the month that the broken oil well had been flowing. “If you keep those kinds of rates up, you could draw the oxygen down to very low levels that are dangerous to animals in a couple of months,” she said Saturday. “That is alarming.”
Clearly, if the estimates at the higher end turn out to be more accurate, and BP (BP) is unable to effect an early end to the leaks, then the issue of internalizing externalities should become even more pressing. Here is one last picture in which to frame the argument.
Figure 3: Small country domestic production, consumption, imports, in a product market with externalities.
If there are negative consumption externalities, then the Marginal Social Benefit (downward sloping bold line) curve is below the demand curve; if there are negative production externalities, then the Marginal Social Cost (upward sloping bold line) curve is above the cost curve. The private market delivers the amount of imports indicated. The optimal level of imports might be smaller or greater than that delivered by the private market, but is indicated by the gap between the bold dashed line.
The standard, textbook, solution is to internalize the externalities by a combination of taxes and/or subsidies (well, in this case, just taxes).
Disclaimer: This page contains affiliate links. If you choose to make a purchase after clicking a link, we may receive a commission at no additional cost to you. Thank you for your support!


Leave a Reply