Last week ended on a positive note with stocks and commodities pushing higher into Friday’s close. The market overall is looking very unstable here and this week I figure there will be some big price movement.
Below are the charts on the DIA, GLD, SLV, UNG and USO funds so you can get a feel for the trend and additionally what I am looking for this week with respect to prices.
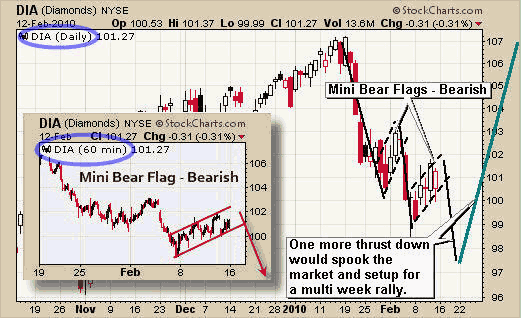
Diamonds Trust (DIA) – Daily & 60 Minute Chart
The Dow, along with the other indexes, has formed a bear flag and can be seen on the daily and 60 minute intraday charts below. This price pattern is a negative one and points to lower prices in the coming week.
If we get one more thrust down I figure it will spook the rest of the weak hands which in turn is a setup for a very nice multi week rally. If this flag turns into a rally then we will simply wait for a pullback and buy when there is a low risk setup.
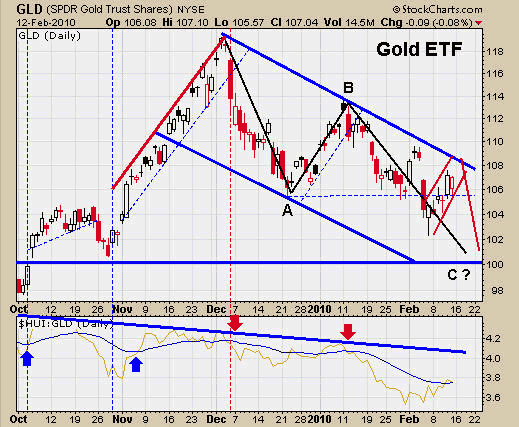
SPDR Gold Trust (GLD) – Daily Chart
Gold has been doing much the same as the over stock indexes and I feel the same will happen here. We could see price rise for another day or two as it tests our blue resistance level before heading lower.
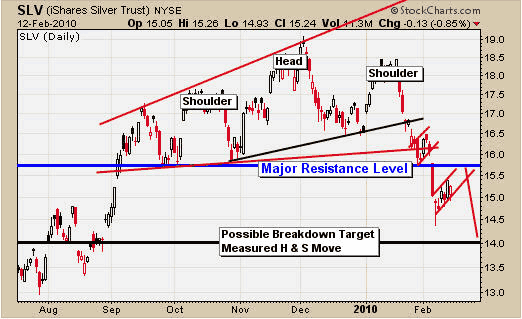
iShares Silver Trust (SLV) – Daily Silver Chart
Silver has formed an interesting pattern the past few months and has now broken down. Silver’s chart continues to look weak as it drifts up to test resistance with a bear flag pattern that points to lower prices in the coming days, much the same as gold.
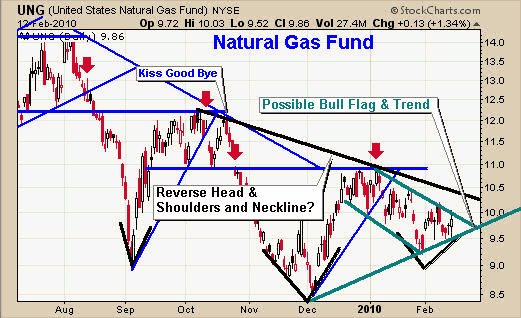
United States Natural Gas Fund (UNG) – Daily Natural Gas Chart
Sorry for all the lines on this chart. It looks like a mess, I know, but it does show a possible trend change in UNG.
The trend has been down for over a year but now it looks as though it’s forming a reverse head & shoulders pattern and possible bull flag. These two patterns point to much higher prices in the coming months.
Natural Gas seasonally rallies in mid February into mid April. So this could be something we could catch for a multi month play. I may provide a stock to trade this rally in gas in addition to the ETF fund in the coming days or weeks, when ever this play unfolds.
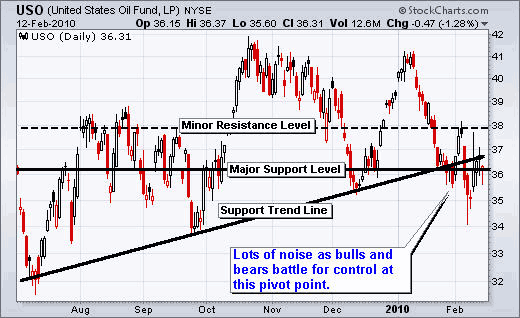
United States Oil Fund (USO) – Daily Crude Oil Chart
Oil has been selling down very strong for the past 6 weeks but it is now trading at a key pivot point. Oil looks as though it’s trying to bottom here and in the next 1-2 weeks I think the energy sector will provide some great trades.
Weekend Trading Conclusion:
Overall, the market and metals bottomed last week or they have another leg down which I expect would happen this week if that’s the case. The charts are pointing to lower prices still. If the market does rally then we will simply watch the breaking and buy the pullback in 1-2 weeks once there is a low risk setup.
I hope everyone had a great weekend and valentines day. My daughter Mirabelle was born this weekend on Feb 14th (Valentines Day). Everyone is healthy and happy!
Disclaimer: This page contains affiliate links. If you choose to make a purchase after clicking a link, we may receive a commission at no additional cost to you. Thank you for your support!


Leave a Reply