Unemployment went up but the rate went down. The total unemployed rose a whopping 1.4M more than we had thought, from 7M to 8.4M. And yet the unemployment rate improved!? We have entered the the Bureau of Labor Statistics (BLS) twilight zone.
Let’s start with the 1.4M increase in unemployed. Several days ago the BLS admitting that they had “created” 1.8M statistical jobs, which is more than the Obama administration claims the Stimulus “saved or created” in real jobs!
These statistical jobs come from the BLS birth/death model, which they know is flawed. Today the BLS began adjusting away those statistical jobs, dropping 1.363M jobs (617,000 in 2009 and some 750,000 in 2008). Total unemployed since the Great Recession started is now higher than we thought, at 8.4M. The BLS “thought” it was only 7M as of three days ago. 1.4M more jobs lost, and the unemployment rate improved! These jobs were “lost” in prior periods:
The workforce is still shrinking, and except for a blip in Nov due to temp workers (retail!), has dropped for 25 straight months (over 2 years!). Yet the unemployment rate has improved.
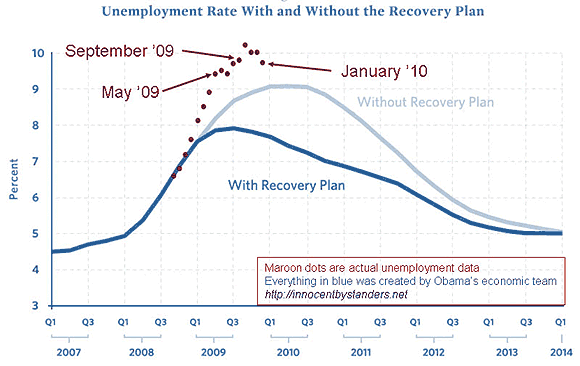
We remain in a land of statistics that are masking the underlying reality. One reason the rate improved is the post-Christmas seasonal adjustment; without seasonal adjustments the rate would have risen to 10.6%, not fallen to 9.7%. With them, the rate now looks like it peaked in Oct and is dropping:
The pop up in Oct provoked a rant about seasonal adjustments from the NYT, that the rate should have held steady at 9.5% at that time since the seasonal adjustments were based on flawed retail patterns. Retail has many fewer outlets after the bankruptcies in 2008, so using the prior pattern of temp hiring into Christmas overstates unemployment by expecting more temp jobs than occur. In the same way, using the prior pattern of a drop in those temp jobs in Jan would now understate unemployment by adjusting as if more would be lost than were.
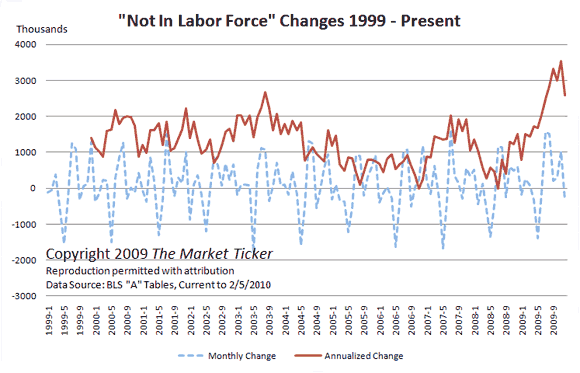
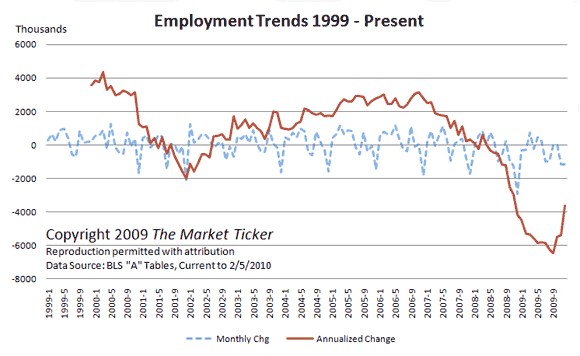
You can see in this next chart how large the January “not in labor force” adjustment is (the blue line below, with that steep drop every January). These are guesses that get adjusted again later, and you can see how far the adjustments have gone in the last two years (the red line that ends in a hockey stick):
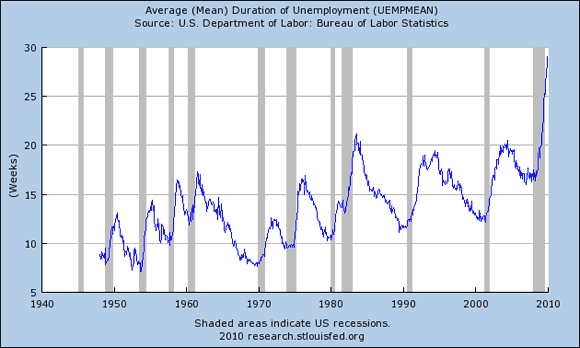
The rate also went down because the total population seeking work dropped more than unemployment. The way the BLS figures it, if you are not “actively seeking work” for 4 weeks, you disappear. You can see how large the disappearance is in the lengthening period of unemployment, spiking up to levels not seen since 1949, when they started measuring it this way:
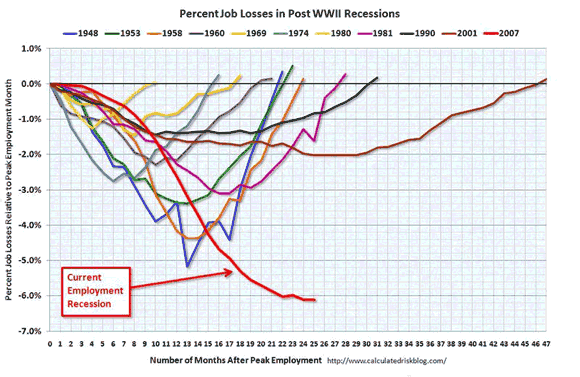
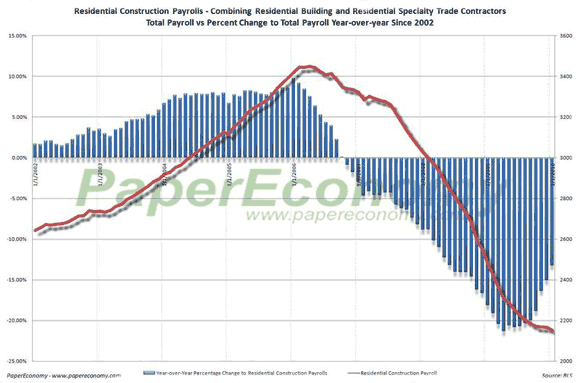
The really scary part of this is it appears we are rapidly creating a huge chunk of the workforce that will be chronically unemployed. I suppose that starts with the housing bubble, which drew a huge workforce into pounding nails in places like Nevada. After a real estate bubble, jobs don’t come back for 5 – 7 years. One of the tragic consequences of a credit bubble is it gives misleading signals of what jobs to pursue. The Austrians call this malinvestment; in human terms it means chronic unemployment. Here is how bad it is in construction:
The chronic unemployed are left out of the unemployment rate. The BLS concluded this month that the “number of persons unemployed due to job loss decreased by 378,000 to 9.3 million”. They do this every month, and the cumulative miscount is now huge:
There are now a whopping 2.5 million people without a job but want one, yet are not counted as unemployed
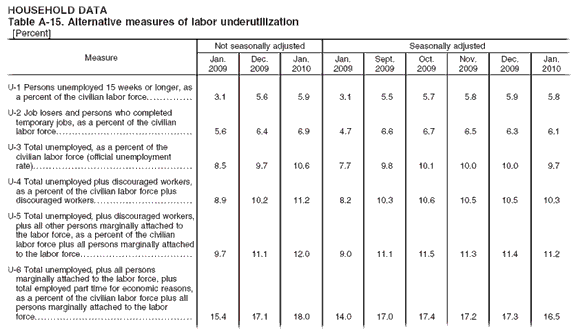
This breaks down into 1.1 million discouraged workers who not currently looking for work because they believe no jobs are available for them, and 1.5 million people who had not searched for work in the last 4 weeks. You can see from the next chart that:
- removing the seasonal adjustment pushes the rate to 10.6%
- including the discouraged workers sends it to 11.2%
- including the ones who haven’t looked for four weeks sends it to 12%
- throwing in the underemployed (U6) sends it to 18%
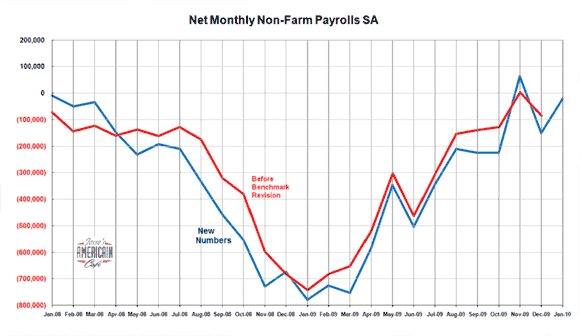
Let’s look at the unemployment problem a different way, which removes all those statistical adjustments: TOTAL EMPLOYED, not the unemployment rate. Sadly, it continues to drop. Our total workforce is back to 2000 levels. A lost decade indeed! When this figure begins to turn up, we will know a real recovery is underway.
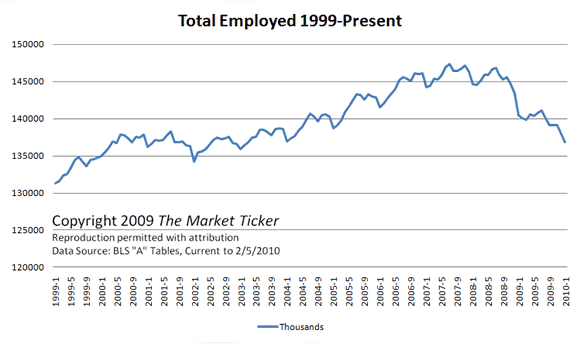
Karl Denninger points out what is striking about this chart: things looked like they were improving for a bit in Q2, but then we faded back down.
The good news is that the rate of loss is lessening. This chart shows the rate of loss, which looks like a V-Shaped recovery, but is still below the 0 line, meaning jobs are still being shed, just at a slower and slower pace.
The official rate should now improve for reasons having nothing to do with a real recovery: we are hiring 3x the normal census workers over the next 6 months, and the addition of 1.4M temp workers should be visible in the rate.
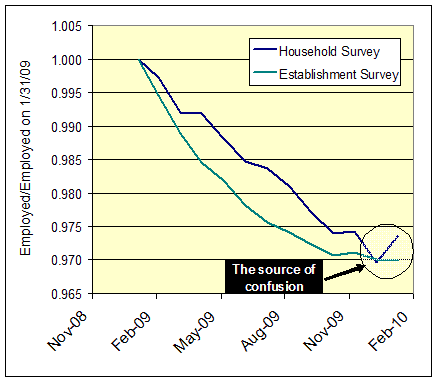
I expect, however, some big adjustments in the next few months. The BLS marries together two separate surveys: one of households and one of big business, or ‘establishments’. The household survey got way out of whack with the establishment survey, and one or the other will have to be adjusted:
I still see a V-Shaped recovery for the next few quarters, and with it a real underlying improvement in unemployment. I just think the “unemployment rate” is a poor place to look to understand the underlying dynamic. Too many shenanigans. As Ed Harrison concluded after looking at the BLS report:
the unemployment rate downtick has nothing to do with people dropping out of the workforce; it is an statistical aberration due entirely to seasonal adjustments in the household survey in the number of people employed and unemployed.
Disclaimer: This page contains affiliate links. If you choose to make a purchase after clicking a link, we may receive a commission at no additional cost to you. Thank you for your support!

Leave a Reply