A recent FT article by Vernon Smith and Steven Gjerstad discusses two big housing crashes, one occurred between 1928 and 1929, and the other occurred between 2006:1 and 2008:2. Both were associated with substantial increases in RGDP. Why didn’t real GDP decline during these two big shocks to a major industry? Why was unemployment so low?
There are two reasons. First, jobs in housing construction are not a particularly large share of total employment. The direct loss of jobs was in the 100,000s, not millions. In addition, many of the workers who lost jobs in construction gained jobs in other sectors. Thus RGDP continued to grow.
The article by Smith and Gjerstad contains two of the best graphs I have ever seen for illustrating the amazing resilience of the US economy. In 1929 (a boom year) housing output fell by roughly 30%. The recent downturn is even more striking. Notice the severe decline in housing for 9 straight quarters during a period where RGDP is trending upward. The ability of RGDP to grow while a major sector is contracting is quite amazing. Yet for some odd reason they drew almost the exact opposite conclusion that I did; they argued that the housing crashes of 1928-29 and 2006-08 caused severe recessions. Why is that?
In my view their key mistake was to misinterpret the role of monetary policy. In each case, housing continued to decline further after the period I cited. And in each case NGDP, which had been growing, suddenly began declining as well. It was the decline in NGDP, not the additional fall in housing, which caused the severe recession and the job losses all across the economy. If NGDP had kept growing at 3% to 5% after 1929, and after 2008:2, the housing downturn probably would have ended, and the economy would have avoided a severe recession.
You might ask; “Isn’t it a bit implausible that two severe recessions would be preceded by housing collapses, if those collapses had no causal role in the recessions?” In fact, the housing collapses and the subsequent recessions probably were related, but in a very indirect fashion. Here’s what probably happened in both cases. As housing declined, the equilibrium “natural rate of interest” began to decline as well. There was less demand for credit. At some point the natural rate fell far below the Fed’s policy rate, causing monetary policy to tighten accidentally. Because Fed officials (and many private economists) wrongly think that the level of interest rates are a good indicator of the stance of monetary policy, they failed to notice that monetary policy had tightened sharply. But the markets noticed, and there were big stock market crashes in October 1929 and October 2008.
But that can’t be the whole problem, because Smith and Gjerstad do discuss the fall in velocity, and correctly attribute it to the decline in nominal interest rates. And of course this fall in velocity is just another way of thinking about the fall in the natural rate of interest that I discussed earlier. So they understand that a housing collapse can reduce interest rates, velocity, and hence NGDP. So again, why do they reach such different conclusions?
I think in the end it has to do with their approach to monetary policy. They view the fall in velocity as something that the Fed would have had a hard time counteracting. And they would undoubtedly point to the fact that the Fed did in fact fail to counteract it. In contrast, I am much more optimistic about the ability of the central bank to maintain stable expected NGDP growth in a period of financial turmoil, and believe that very little of the fall in velocity that Smith and Gjerstad cite was actually caused by the housing slump. Instead, almost all of it was caused by two monetary policy mistakes. One was the failure to do NGDP targeting, level targeting, which would have maintained positive longer term NGDP expectations. And the other error was paying interest on excess bank reserves.
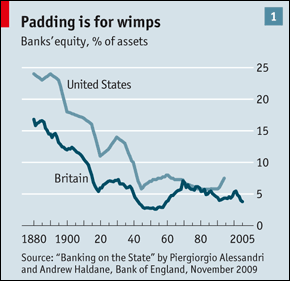
In his Big Think interview, Vernon Smith suggested that banks took excessive risks in the 1920s. This seems plausible, after all, lots of banks failed in the 1930s. But in fact banks were much more conservatively managed in the 1920s than today. If you take a close look at this graph from The Economist, you will see that bank equity was above 10% of assets throughout the 1920s, and was close to 15% on the eve of the Great Depression. So that wasn’t the problem.
 Then what went wrong? Why did so many banks fail in the 1930s? The answer is simple, NGDP fell in half. The funds people and firms use to repay loans comes from income. If nominal income falls in half, there will be many defaults, regardless of how sound the loans seemed before the Depression began.
What about today? It is more complicated. This time Smith is partly right. There were many foolish loans made during the past decade, and we know this because the sub-prime crisis occurred while the economy was still booming in 2007. About all you can say in defense of the banks is that the fall in NGDP after mid-2008 made the losses several times worse than otherwise. But even some of that is the banks fault, as they need to anticipate the possibility of at least a mild recession, although perhaps one can excuse them for not expecting NGDP to fall at the fastest rate since 1938.
In any case, it’s not about blame, it is about figuring out where we go from here. And despite the fact that I diagnose the problem slightly differently from Smith and Gjerstad, I reach almost identical policy conclusions from those discussed by Smith in his recent Big Think interview:
1. We should require much more collateral on loans and derivatives
2. We should raise the price level 6% (although I would substitute NGDP for the price level.)
PS. I couldn’t copy the FT graphs, but this one from The Economist shows just how much of the housing downturn had occurred before the recession even began. Starts had fallen from over two million to roughly one million in late 2007. In the early part of the recession, starts actually leveled off at close to one million, but then fell to 500,000 when NGDP declined sharply.
Disclaimer: This page contains affiliate links. If you choose to make a purchase after clicking a link, we may receive a commission at no additional cost to you. Thank you for your support!


Leave a Reply