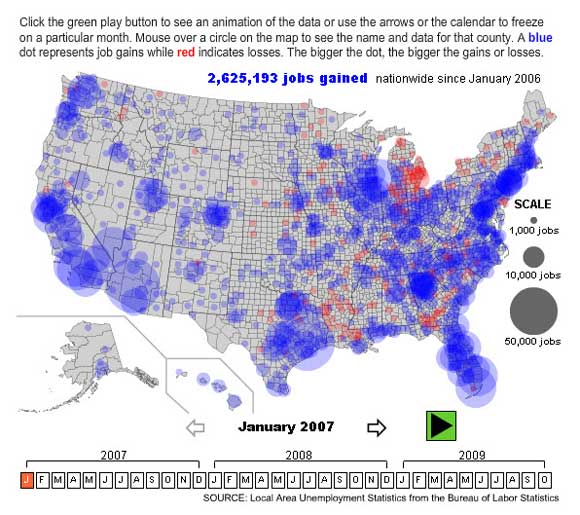
Below is a very interesting Slate.com graph showing the progression of the recession by color-coded jobs losses and gains. Red shows jobs lost, and the bigger the circle the more jobs lost. Blue is job gains. They are 12-month changes, so if jobs rose strongly for 8 months, then fell at the same rate for 4 months, the 12 month change would still be positive, despite the negative trend over the most recent 4 months.
I am going to ask you to either print out my post, or take a few notes before looking at the graph, as I’d like to point out a few interesting patterns. Regional economics is not my specialty, so I will undoubtedly get a few details wrong.
I’d like you to look at the following three months; August 2007, 2008, and 2009. Get used to toggling back and forth. (Hit “start” to get rid of the box.) Here’s what those dates indicate to me:
August 2007: The first signs of the sub-prime bubble bursting appear. Normally growing regions like California’s OC/Inland Empire area show losses. So does Florida’s Gulf Coast. Those are the first signs of recession (which hasn’t yet arrived.) What about the group of cities near Lake Erie, the Detroit/Cleveland/Buffalo area? Well who wants to live there! It’s cold, cloudy, and taxes are high. Of course they are losing jobs. They’ve been losing jobs for decades. And then there are spotty job losses in rural counties where factories have closed down.
Now toggle up to August 2008. Ouch! Compared to 2007 it looks like red ink all over the place. But I think that is misleading. Rather, I would argue that the changes over those 12 months mostly show the effects of “recalculation,” or shifts away from two key industries, along with a very mild recession due to NGDP growing at less than 3%.
The job losses have increased dramatically in California and Florida, but Vegas and Phoenix are still hanging in there (those results may be biased by the 12 month change discussed earlier.) But now there is a second structural problem. Oil had peaked the month before at $147, and the 12 months of relentlessly higher gasoline prices devastated the auto belt from Michigan down to northern Alabama. I’m sure some other energy intensive midwestern industries were also affected. And perhaps furniture making in North Carolina was hurt by housing. New England and upstate NY are a bit misleading, as with near-zero population growth they are always on a knife edge between gaining and losing jobs.
Am I sugar-coating a bad situation? Am I trying to deny that these structural problems could cause a recession? My response is that if you want to see a real demand-side recession, if you want to see what happens if NGDP falls significantly, toggle back and forth between August 2008 and August 2009. Look at what 12 months of falling NGDP does. And then tell me that our problems are all caused by a few nutty housing markets in SoCal/Vegas/Phoenix and Florida. Keep toggling until the 2009 mass of red is permanently impressed in your retina, and connected to the part of your brain that stores the phrase “falling NGDP.”
PS. I spent Christmas in the county with America’s biggest jobs gain between August 2008 and August 2009. This means that it’s even misleading to say “Arizona” was a sub-prime fiasco, as Tucson is still doing OK.
Disclaimer: This page contains affiliate links. If you choose to make a purchase after clicking a link, we may receive a commission at no additional cost to you. Thank you for your support!


Leave a Reply