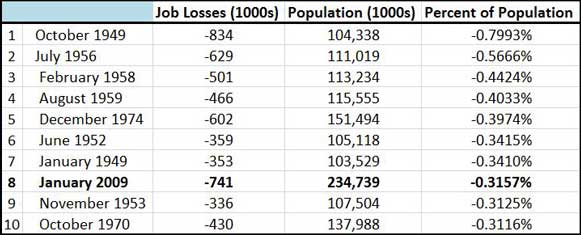
The chart below shows the top ten months since 1948 for monthly job losses (total nonfarm payroll) as a percent of the civilian non-institutional population (data here). The loss of 741,000 jobs in January 2009 was the second highest in BLS history back to 1948, second only to the loss of 834,000 jobs in October 1949. Adjusted for the size of population though the job loss in January 2009 ranks #8, and is the only month of job losses in 2008 or 2009 that was among the top ten months since WWII.
We hear a lot of news reports about jobless claims and job losses, but they are almost never adjusted for the size of the population, which has increased by 125% since the late 1940s. To put today’s jobless claims or job losses in context, shouldn’t we adjust for the size of the population?
Disclaimer: This page contains affiliate links. If you choose to make a purchase after clicking a link, we may receive a commission at no additional cost to you. Thank you for your support!


Leave a Reply