Here is a graphical look at how different investments, from REIT shares to crude oil, fared last week.
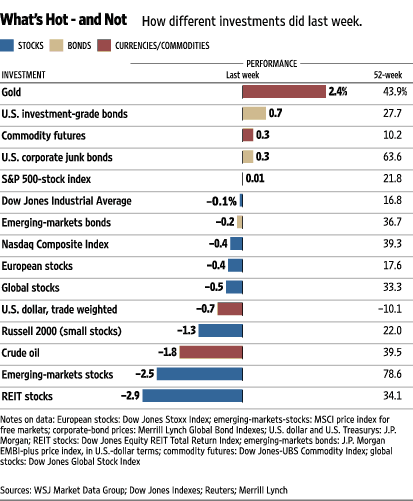
If one of your primary objectives is to produce positive investment returns while having a low probability of incurring losses in a reasonable time frame, then gold, which is often bought as a hedge against impending inflation and also renowned for its ability to provide a safe haven in times of financial instability, is the asset class of the moment. As you can see from the chart above, the yellow metal is this week’s top performer ; printing 2.4% in positive returns. On a year/year basis gold is up nearly 44%, followed by bonds, commodity futs, junks, and S&P: 0.7%,0.3%,0.3%, and 0.01%, respectively.
REITs, EMs and Oil ranked as the list’s worst performers.
Graph: WSJ
- Bulenox: Get 45% to 91% OFF ... Use Discount Code: UNO
- Risk Our Money Not Yours | Get 50% to 90% OFF ... Use Discount Code: MMBVBKSM
Disclaimer: This page contains affiliate links. If you choose to make a purchase after clicking a link, we may receive a commission at no additional cost to you. Thank you for your support!
Leave a Reply