The chart below ranks the best to worst performing asset classes of different major global financial markets:
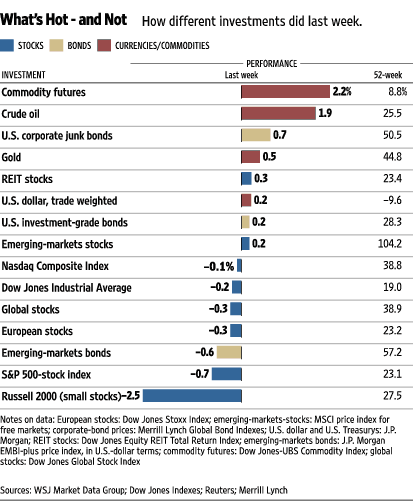
Commodity futures are this week’s asset class leader. As the chart illustrates, this segment of the market dominated the performance spectrum by gaining over 2%, followed by Oil, Junk bonds and Gold, 1.9%, 0.7%, and0.5%, respectively. Meanwhile, Naz is the list’s top underperforming asset class, posting 0.1% in negative returns, followed by Dow (-0.2%) and Global stocks (-0.3%).
Despite this week’s underperformance from various asset classes, significant improvements continue to reflect the chart’s overall year-over-year returns. EM stocks and bonds remain the list’s leaders with 104.2% and 57.2% in gains, respectively.
Graph: WSJ
- Bulenox: Get 45% to 91% OFF ... Use Discount Code: UNO
- Risk Our Money Not Yours | Get 50% to 90% OFF ... Use Discount Code: MMBVBKSM
Disclaimer: This page contains affiliate links. If you choose to make a purchase after clicking a link, we may receive a commission at no additional cost to you. Thank you for your support!
Leave a Reply