
JPMorgan’s Ryan Brinkman slashed this morning his 2016 earnings per share estimate for Tesla Motors Inc (NASDAQ:TSLA) to ($0.32) from $1.60. The analyst said the EPS reduction is a reflection of lower revenue and higher operating expenses following the company’s second-quarter financial results, which were worse than the Street was expecting. Tesla reported $1.56 billion in revenue and a non-GAAP loss of $1.06 a share Wednesday, $0.41 worse than consensus estimate of ($0.65) and wider than its $0.48 loss in the year-ago quarter. Q2 GAAP net loss came in at $293 million, or a loss of $2.09 per share. Furthermore, the company said it expects capex to increase significantly in coming quarters. Tesla has already spent more than half a billion dollar on capital needs so far this fiscal year. The electric car maker currently has $3.2 billion on its balance sheet.
It is worth noting, though, that Tesla’s Q2 revenue rose 30.5% on a year-over-year basis. But then again, while revenue rose, so too did expenses, and all of this contributed to a wide miss on the earnings front on a year-over-year basis. Addressing this point, Brinkman, who reiterated an ‘Underweight’ rating on Tesla stock with a $180 12-month base case estimate, highlighted the fact that his 2016 EPS forecast was $4.62 in FY2015 and $2.74 at the start of this year. This reflects the “degree of consistent ratcheting down of near-term earnings,” Brinkman noted in his post-earnings research note to clients and investors.
Tesla Stock Price Reaction
Investors don’t seem to care too much about the increased costs that Tesla is incurring. Apparently, the ticker is mostly being measured by top-line growth. That’s why so far this morning, TSLA is indicated almost flat at $225 and change.
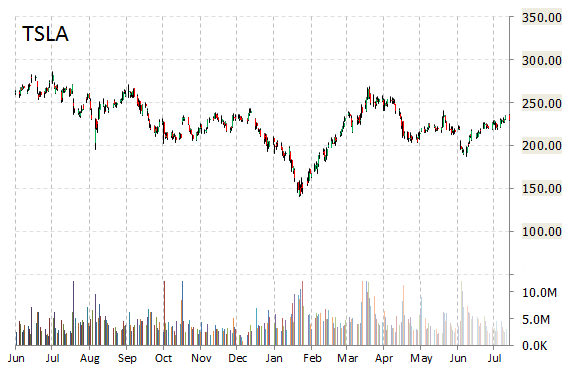
Technically speaking, Tesla Motors stock has been building a relatively tight upper level mini-base above its 50-day MA located at $218.57 with an accelerated uptrend intact since early July. Although the name trades in the red on a y/y and year-to-date basis, its current standing represents a notable improvement from its late $193 June level. That said, we believe that TSLA’s overall long-term trend remains bearish-meaning, if the stock doesn’t find good support around the $218 zone, then a move down through that level could lead towards $200.
Disclaimer: This page contains affiliate links. If you choose to make a purchase after clicking a link, we may receive a commission at no additional cost to you. Thank you for your support!

Leave a Reply